Table of Contents
- Accounts Category
- Financials Category
- Account Balances and Available Credits
- Accounts Receivable Reconciliation
- Adjustments, Discounts, and Overrides
- Aged Receivables
- Anchor/Linked Dashboard
- Delinquency
- Due Invoices
- Financial Overview
- General Overview
- Invoiced Revenue
- Invoiced Transactions by GL Code
- Payments
- Refunds and Reversals
- Revenue Growth and Contraction
- Sonar Billable Accounts
- sonarPay Disbursements
- Taxes
- Uninvoiced Transactions
Understanding Sonar Reports
 Updated
by Mitchell Paul-Soumis
Updated
by Mitchell Paul-Soumis
- Accounts Category
- Financials Category
- Account Balances and Available Credits
- Accounts Receivable Reconciliation
- Adjustments, Discounts, and Overrides
- Aged Receivables
- Anchor/Linked Dashboard
- Delinquency
- Due Invoices
- Financial Overview
- General Overview
- Invoiced Revenue
- Invoiced Transactions by GL Code
- Payments
- Refunds and Reversals
- Revenue Growth and Contraction
- Sonar Billable Accounts
- sonarPay Disbursements
- Taxes
- Uninvoiced Transactions
Read Time: 55 mins
Every instance in Sonar is packed with information that, if extracted, will benefit your business in numerous ways. The easiest, and best, way to extract this data from your instance is through the built-in Business Intelligence reporting, offered to all clients.
Accessing your reports is easy — simply click on the “Reports” button in the navigation sidebar. By default, you'll see all the following reports:
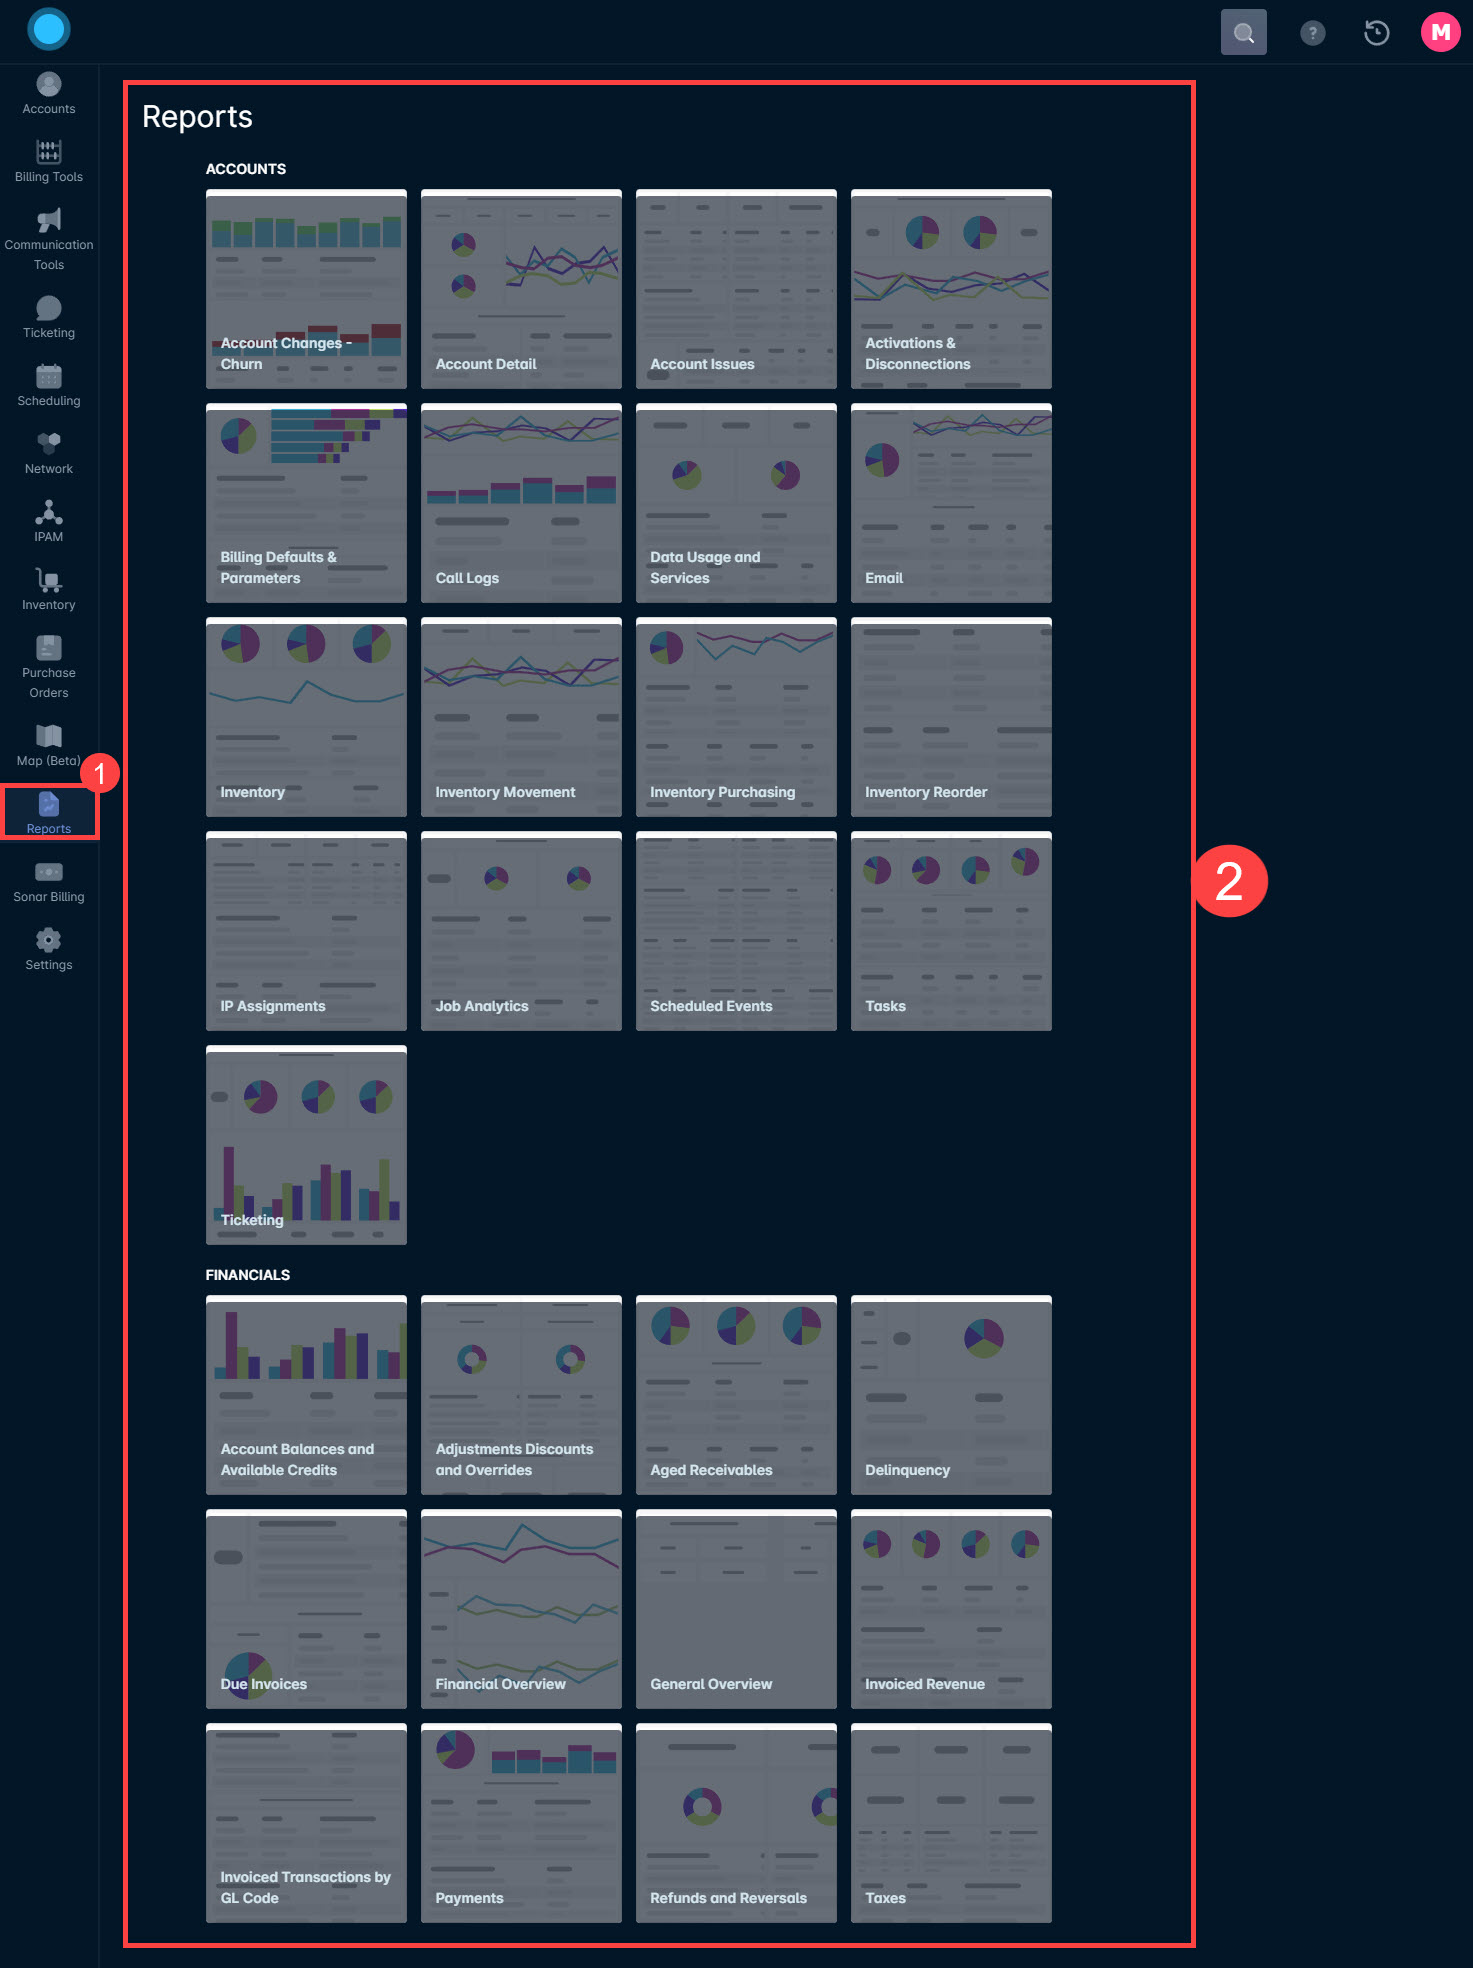
To make it easier to understand how each report can be used to promote your business's growth and success, this article will cover each section, and each report's contents, in detail. This way, you'll be able to gather data relevant to you and your organization without guesswork.
Accounts Category
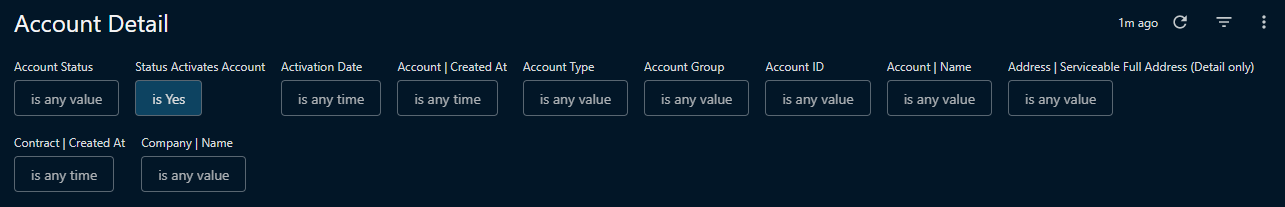
Account Churn — Status Changes
The “Account Churn — Status Changes” report is in place to help your business monitor customer accounts as they move through various statuses as subscribers. While the term “churn” is often associated with users moving between different service providers, it can also be used to indicate some transition in status. This report will help shed light on how your customers move around within your business.
Active Filters by default
Report field details
1) The Account Acquisition Churn: Lead / Install to Active section is displayed as a bar graph, showing the churn change month over month.
2) The Account Acquisition Churn Detail: Lead to Active table provides additional detail on the accounts that have transitioned to an active status over the filtered time period.
3) The Account Loss Churn: Active to Inactive Status section is displayed as a bar graph and shows the churn change to inactive month over month.
4) The Account Loss Churn Detail: Active to Inactive table provides detailed information on the accounts that have churned to inactive over the filtered time period.
5) The Account Group Changes — Added, or Removed table provides detailed information on the accounts whose Account Groups have changed within the filtered time period.
6) The Account Type Changes — Updated table provides detailed information on the accounts that have had their account type modified within the filtered time period.
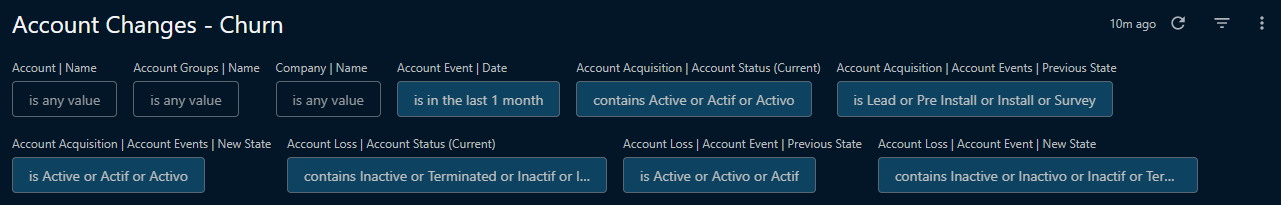
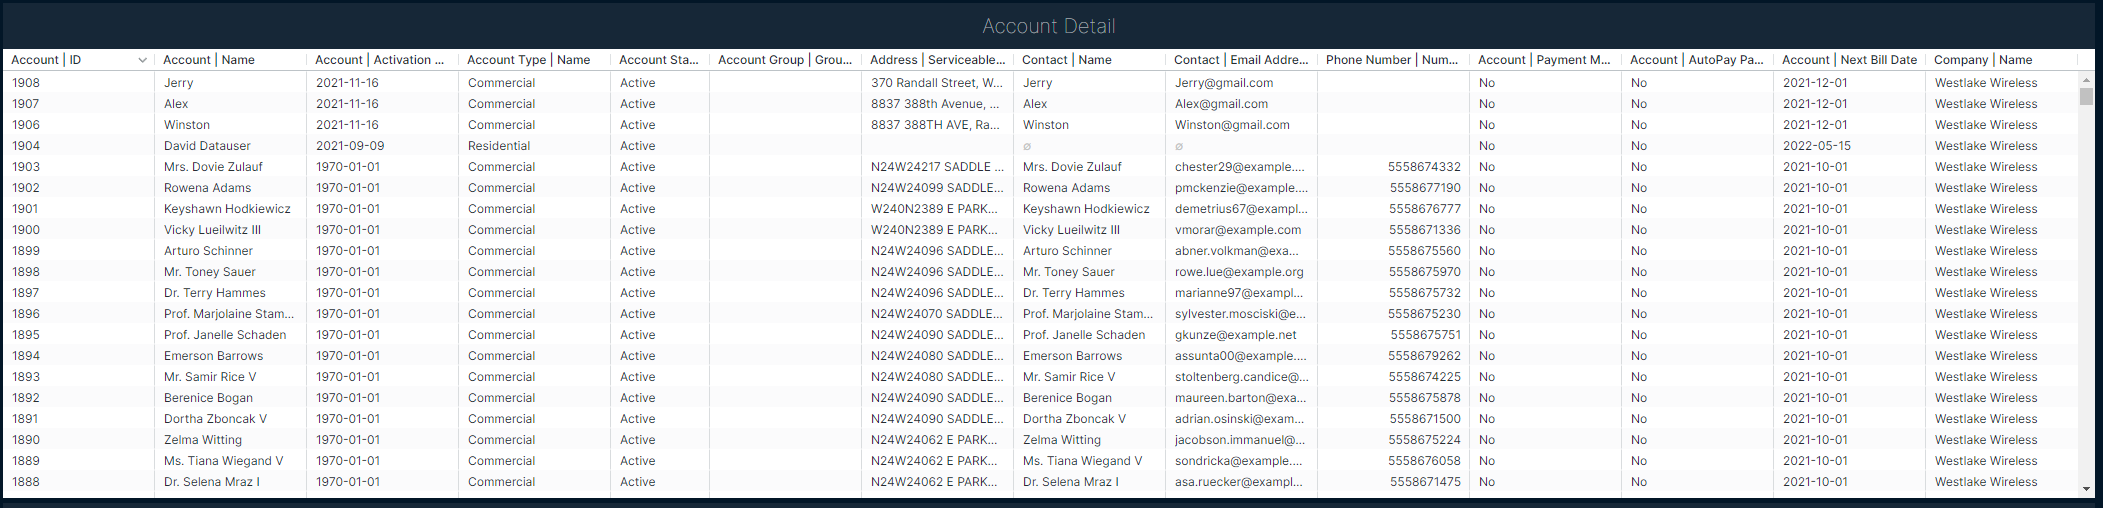
Account Detail
The Account Detail Report is the resource you'll want to use when monitoring active or inactive customer accounts. This report breaks down detailed information on the health of accounts in your instance, from overall account numbers to contracts and to some billing details; this report is a primary tool for diving deep into your data. By default, this report is filtered to only show accounts in an active status.
Active Filters by default
Report field details
1) The Total Account breakdown shows you basic information for the accounts in your instance, such as the total number of accounts, breakdowns by status and type, and a plot graph of their activation dates.
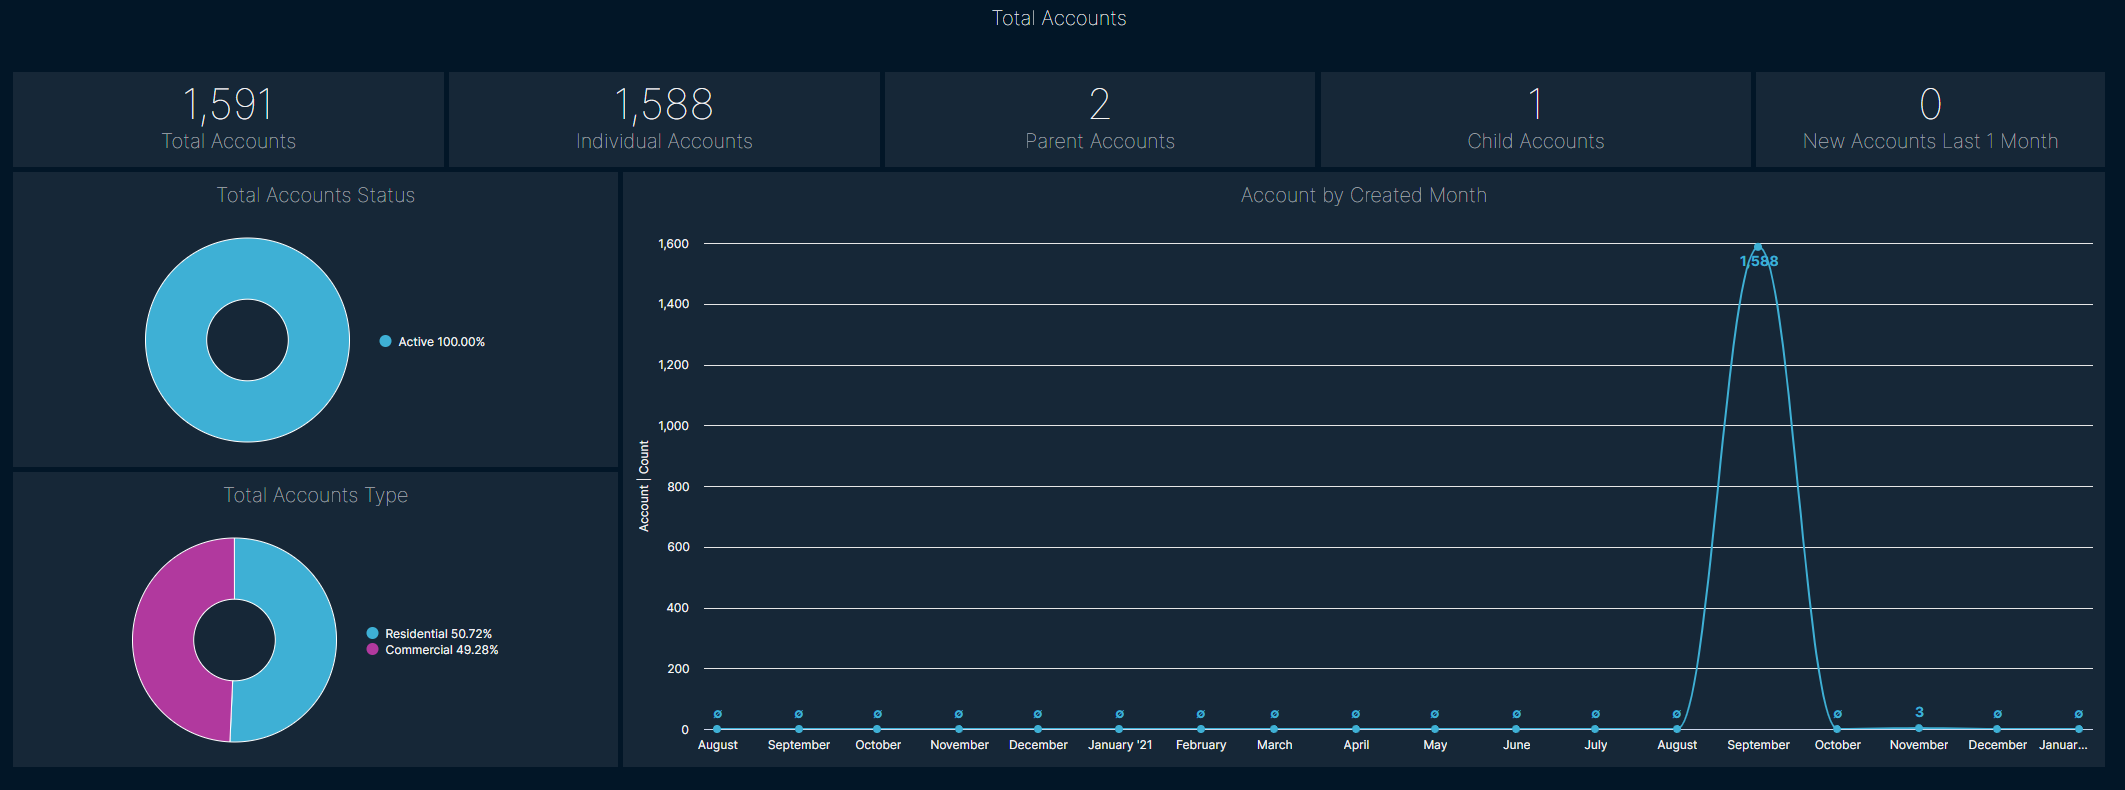
2) The Accounts Segment is divided into two sections:
a) The Parent Accounts Detail table will show you all parent accounts in your instance and details on the number of child accounts each parent account has.
b) The other table, Child Accounts Detail, shows details for the child accounts in your instance, including their account information and information on the parent account they belong to.
3) The Account Detail table provides an expansive look at your customer data, providing an easy way to view basic information for every account in your instance.
4) The Multi-Month Billing — Months to Bill section will visualize the number of accounts at each multi-month billing frequency (ex: 3 accounts billing every month, 4 accounts billing every 2 months, 2 accounts billing every 3 months, etc.). The accounts displayed here will be based on the individual account's billing parameters.
5) The Contracts and Billing segment contains information on contracts, printed invoice statistics, and some minor tax exemption counts in your instance:
a) The Contracts Pending Signature section lists the total number of generated contracts on customer accounts in a “Pending Signature” state.
b) The Contracts Pending Signature Detail table provides information on the accounts that have the contracts on their account in a “Pending Signature” state, in addition to information on the contract itself.
c) The Tax Exempt section provides you with the number of accounts in your instance listed as tax-exempt in their individual billing configuration.
d) The Tax Exempt Detail table provides information on the exempt accounts and their billing configuration.
e) The Contracts Existing with Signature table shows the contract and account information on accounts where contracts that have been digitally signed exist.
f) The Accounts with Printed Invoices table provides details on the accounts and their billing parameters for any accounts that have the “Print Invoice” option enabled.
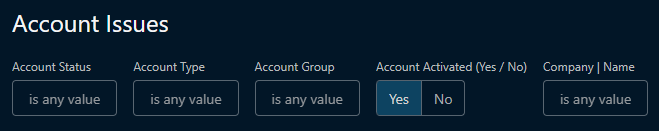
Account Issues
The Account Issues report is useful for determining the health of your customer accounts at a glance. Using this report allows you to verify payment information, confirm contract health, and monitor the autopay, address, and GL Code status of accounts and services in your instance. By default, this report is filtered to only show accounts in an active status.
Active Filters by default
Report field details
1) The Credit Cards Expiring Next Month is fairly straightforward and displays the total cards added as payment methods expiring in the next calendar month.
2)The Credit Cards Expiring This Month section shows a total of the cards added as payment methods expiring within the current calendar month.
3) The Contracts Expired Last 30 Days will list the total number of contracts whose expiry fell within the last 30 days across your customer accounts.
4) The Contracts Expiring Next 60 Days will list the total number of expiring contracts whose expiry dates fall within the next 60 days across your customer accounts.
5) The Cards Expiring This Month table provides you with further details on which account has a card set to expire this month.
6) The Recently Expired Contracts Detail table provides a detailed breakdown listing which accounts and which contract(s) expired.
7) The Cards Expiring Next Month table provides you with further details on which account has a card that will be expired next month.
8) The Expiring Contracts Detail table provides a detailed breakdown of accounts that have a contract(s) with an upcoming expiration.
9) The Accounts Without Payment Methods section will display the number of accounts in your instance with no credit card or bank account associated with their account.
10) The Accounts Without Payment Methods Detail table provides a detailed breakdown of the accounts that have no credit card or bank account associated with their account.
11) The Accounts Without AutoPay section will display the number of accounts that don't have the autopay feature activated on any of their payment methods.
12) The Accounts Without AutoPay Detail table provides a detailed breakdown of the accounts without the autopay feature enabled on any of their payment methods.
13) The Accounts Without Primary Email Addresses section will display the total number of accounts where the primary contact does not have an email address.
14) The Accounts Without Primary Email Address Detail table will list additional information on the accounts without a primary email address.
15) The Accounts Without Recurring Services section will display the total number of accounts without any recurring services.
16) The Accounts Without Recurring Services Detail table will provide additional information on the accounts that have no recurring service added to them.
17) The Accounts Without Serviceable Addresses table will list all accounts in your instance that currently have no serviceable address but remain active.
18) The Accounts without Lat/Long table will list all accounts in your instance that do not have Latitude or Longitude details on their serviceable address.
19) The Duplicate Account Names table will list all accounts in your instance that share the same account name.
20) The Services Without GL Codes table will allow you to quickly verify which services you have created and are active in your instance without a corresponding general ledger code.
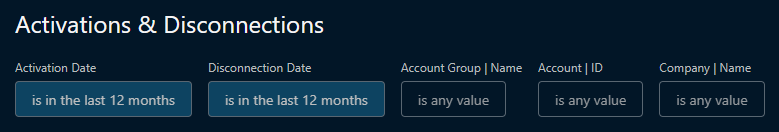
Activations & Disconnections
The Activations & Disconnections report is used to review customer accounts being activated or disconnected within a specified time period in your Sonar instance. This data analysis can be helpful in establishing trends whether they're geographical, seasonal, or promotional.
Active Filters by default
Report field details
The following information is available underneath the Standard Account Activation and Sonar Disconnect Feature section:
1) The Accounts Activated section provides a total number of accounts that have an initial activation date within the filtered time period.
2) The Activated — Top 50 Account Groups pie chart allows you to visualize the number of accounts activated per account group, up to 50 groups. Each section of the pie chart can be selected for more details on the accounts activated within those groups.
3) The Disconnected — Top 50 Account Groups pie chart allows you to visualize the number of accounts disconnected based on the group, up to 50 groups. Each section of the pie chart can be clicked on to obtain additional information on the disconnected accounts within that group.
4) The Accounts Disconnected section provides the total number of accounts that have been disconnected, via Sonar's disconnect feature, within the filtered time period.
5) The Trending Activations and Disconnections section uses a plot graph to display historical numbers of customers activated or disconnected by month. Each point on the plot can be selected to obtain further details on the individual accounts.
6) The Accounts Activated Detail table lists additional details on the accounts that have an initial activation date within the filtered time period. This table will list the same number of accounts as the Accounts Activated section.
7) The Accounts Disconnection Log Detail table provides additional information on the accounts that have been disconnected within the filtered time period. Note that it's possible for this table to list out a larger number than the Accounts Disconnected section, in scenarios where the same account was disconnected multiple times within the filtered time period.
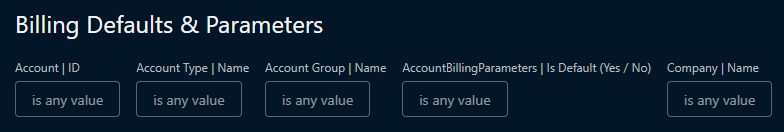
Billing Defaults & Parameters
The Billing Defaults & Parameters report lets you quickly assess the overall status and efficacy of your default billing parameters by allowing you to review existing billing defaults, and the accounts that use them as is.
Active Filters by default
Report field details
1) The Accounts with Default Billing Parameters pie chart breaks down all accounts in your instance, and shows which percentage has default versus non-default billing parameters. Each section of the pie chart can be expanded to show additional details regarding the accounts.
2) The Accounts per Billing Default bar graph visualizes how many accounts belong to each billing default in your instance. Each bar can be clicked on to receive further details about the individual accounts.
3) The Account Billing Parameters table displays a list of all accounts in your instance and their current billing parameters. Cells highlighted in red mean the value does not match the default billing parameters as determined by the Billing default associated with their account type.
4) The Billing Defaults table allows you to quickly review all your billing defaults and their basic billing details.
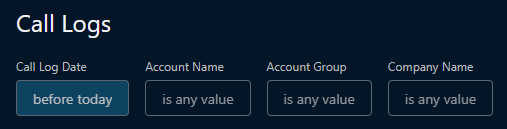
Call Logs
The Call Logs report lets you review the details of phone interactions your staff has logged with customers. By running the report, you avoid the need to review call logs on an account-by-account basis, providing faster access to meaningful data.
Active Filters by default
Report field details
1) The Metrics Last Month (in seconds) section will show you an overall breakdown of the time your employees spent on the phone with customers in the last month.
a) The first metric is Call Log | Min Call Log Time, which will show you the shortest call log time in the last month.
b) The second metric is Call Log | Average Call Log Time, which will show you the overall average time in seconds of all call logs made by your employees.
c) The third metric is Call Log | Max Call Log Time, which will show you the amount of time the longest call record was recorded for in your instance.
2) The Call Logs Count by Month with Average visualizes the call log data in a bar graph, and allows you to review call logs that occurred over the last 12 months, with an average displayed alongside this data.
3) The Call Logs table allows you to review all logs made within your instance, which includes details of who took the call, who made the call, and both the call log subject and body.
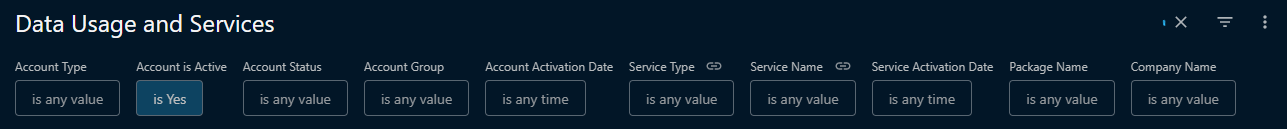
Data Usage and Services
The Data Usage and Services report is useful when reviewing overall network capacity usage across your instance, whether from an upgrade or pricing perspective. If you find that your network backhaul is frequently congested, reviewing this data may allow you to determine if it's due to a few outliers or overall usage. Conversely, if the network isn't being used to an appropriate capacity, confirming this information may allow you to deploy smaller value packages to users to maximize revenue on your existing resources.
Active Filters by default
Report field details
1) The Account Count field will list the total number of accounts in your instance. While one of many reports that include this field, it's useful here as data usage and services would apply to every account you're delivering service to, and being able to see both metrics concurrently provides more useful data than having to jump between reports.
2) The Accounts With 0 GB Used will list the number of accounts in your instance that meet all service criteria, but haven't used any data in the current filtered time period. If this number is high, it may indicate an issue with how you're collecting user data for collection in Sonar.
3) The Accounts Over Data Quota section will list the total number of accounts over their allotted data usage limit, set within the Settings > Billing > Usage-Based Billing Policies section.
4) The Service Subs by Type pie chart will visualize the various service types in your instance that are applied to customer accounts. You can click on each service type to gather details about the accounts that have a matching service applied to them.
5) The Service Subs by Name pie chart allows you to visualize which specific services are assigned to accounts. Each section of the pie chart can be selected for additional details on the accounts.
6) The Accounts Over Data Usage Quota detailed table will show you a breakdown of all accounts that have exceeded their allowed usage, as set out by the Usage Based-Billing Policy.
7) The Data Usage Details table will list all accounts that currently have a data service and will display their current data usage information.
8) The Accounts Detail table will list details of all accounts in your instance, allowing you to quickly cross-reference various details between data usage and account details.
9) The Accounts with Service Detail table breaks down the account information even further, providing you with additional information on which service each account is using, and how it's being applied.
The Emails report allows you to review the email usage throughout your instance, rather than having to review sent emails account-by-account. Functionally, this report allows you to verify mass emails and automated emails were sent successfully to the intended recipients, and breakdown which customer segment is receiving communication.
Active Filters by default
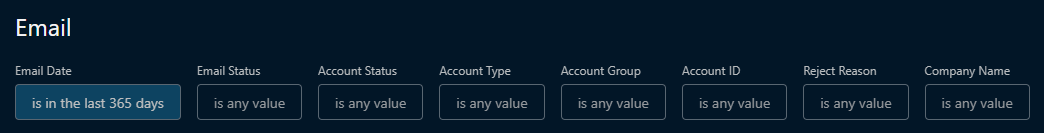
Report field details
1) The Total Sent Emails will provide the number of emails sent within the filtered time period.
2) The Total Emails Over Time graph will allow you to visualize how many emails have been sent month-over-month.
3) The Emails by Account Type visualizes how many emails were sent to which account type in a pie chart. Each account type can be clicked on to obtain more details regarding the specific accounts receiving emails.
4) The Count of Total Emails per Account graph allows you to quickly see which accounts are receiving email in your system, breaking down the list by how many emails each account has received within the filtered time period.
5) The Email Details table will list each email sent out of your instance, along with the message contents and recipient information.
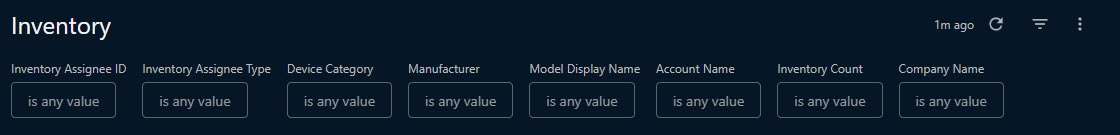
Inventory
The Inventory report offers a convenient dashboard to track inventory assignment, holdings, and acquisition and works with the Inventory Movement report as one piece of the puzzle when monitoring your entire inventory's lifecycle.
Active Filters by default
Report field details
1) The Inventory by Assignee pie chart allows you to visualize how inventory is being used, organized by the assignee, in your instance. Each assignee segment can be clicked on for additional details regarding the specific items and assignee details.
2) The Inventory by Manufacturer pie chart allows you to visualize how inventory in your instance is organized by manufacturer, and each manufacturer can be clicked on for more information about the individual items.
3) The Inventory by Category pie chart allows you to visualize the inventory added to your instance by how the models have been categorized. Each category can be clicked on to obtain more information about the inventory models and items.
4) The Items Over Time plot graph allows you to easily keep track of inventory that has been added or removed from your instance, making it simple to track inventory variance.
5) The Inventory and Generic Inventory by Assignee table occupies a similar role as the Inventory by Assignee pie chart, but breaks down the inventory assignments in more detail immediately, rather than first needing to select an assignee.
6) The Inventory and Generic Inventory by Warehouse table lists all items that are stored in an inventory location within your system, rather than assigned to an individual, address, or other assignees.
7) The Inventory Assigned to Inactive Accounts table lists all items that are currently assigned to an account that is in an inactive status. Note that this will not include accounts that are in an inactive status as a result of being disconnected, via Sonar's disconnect feature; this is because inventory is tied to the serviceable address, and Sonar's disconnect feature removes the serviceable address from the account.
8) The Accounts Without Inventory table will list all accounts in your instance with no inventory currently assigned. Because Sonar assigns IP addresses through the inventory item, an item not being present means these accounts may be set up incorrectly, or your organization may not be fully using Sonar features.
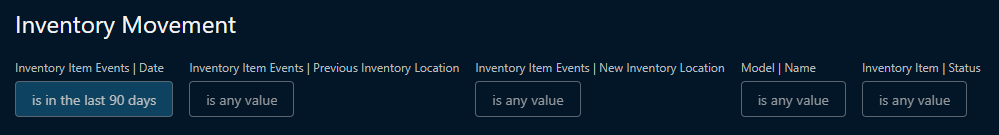
Inventory Movement
The Inventory Movement report works as a second stage to monitor the lifecycle of inventory items in your instance. Where the Inventory report allowed you to get a general overview of the models and items in your instance, the Inventory Movement report looks specifically at the way your inventory moves between inventory locations.
Active Filters by Default
Report field details
1) The Inventory Movement Count | Today section provides the total number of inventory items that have changed inventory locations during the current day.
2) The Inventory Movement Count | Last Week will show the number of inventory items that have changed inventory locations over the last 7 days.
3) The Inventory Movement Count | This Month will show the number of inventory items that have changed inventory locations within the current calendar month.
4) The Inventory Movement Count | Month Over Month plots the overall movement of inventory items throughout the year over the last several years of data, concurrently. This allows you to review historical and current movements, and compare the data to ensure everything fits your expectations.
5) The Inventory Movement table will track all inventory movement within the filtered time period while providing the inventory location and movement details.
Inventory Purchasing
The Inventory Purchasing report is focused entirely on the Purchase Order module in your Sonar instance. Each field in the report examines a different facet of your organization's Purchase Order system, from total number of purchases to specific spending at each vendor.
Active Filters by Default

Report field details
2) The Purchase Orders by Quarter section charts the number of created Purchase Orders Quarter-by-Quarter, for the last 4 quarters.
3) The Purchase Order Overview table provides a brief breakdown of all Purchase Orders created within the timeframe determined by your filters.
4) The Purchase Order Detail table provides a detailed breakdown of all Purchase Orders within the timeframe determined by your filters. This table should contain records that match the overview table exactly.
5) The Inventory & Generic Inventory by Warehouse table will provide a breakdown of Inventory added to your instance, ordered by Warehouse ID. This list can include inventory that has never been previously ordered.
6) The Vendor Spend over Time table will list the details of total transaction amounts made with each Purchase Order vendor over the last 12 months, with an additional total column representing the complete 12-month spend at each vendor.
7) The Inventory Purchase Price table will list all inventory items added to your Sonar instance, displaying their assignee and warehouse amounts. Most importantly, this table includes a Purchase Price column, allowing you to quickly review pricing for each item.
Inventory Reorder
The Inventory Reorder report facilitates the constant maintenance of your stocked inventory items, based on thresholds you define on each model. While this report contains few fields, both fields are essential to a well-run inventory system.
Active Filters by Default

Report field details
2) The Location Inventory Reorder table will list all inventory items in your instance, as long as those inventory models were created with a Min/Max value relative to a specific inventory location. This table provides information on current inventory levels, minimum inventory levels, and maximum inventory levels.
IP Assignments
The IP Assignments report was built with the purpose of summarizing the IP networking information in your instance, such as IP assignment counts and largest CIDR available, the range and total IPs available within IP pools, as well as details of IP assignments made within your instance and the account information for accounts that have IPs assigned. All of these allow you to see how and where your IP addresses are being allocated and dive further into the specific details of an assignment, as needed; additional IP information can always be found within the IPAM section of your Sonar instance as well.
Active Filters by Default

Report Field Details
2) The Total IP Pools section shows the number of IP Pools created in your Sonar instance, regardless of IP availability. Clicking on the number opens a table with additional details.
3) The Total IP Assignments section shows the number of assigned IP addresses across all pools and subnets. Clicking on the number opens a table with additional details.
4) The Total Network Site IPs section shows the number of IP addresses assigned to Network Sites in your instance. Clicking on the number opens a table with additional details.
5) The Subnet — IP Assignment Count & CIDR section provides details on the different subnets within your instance, including when they were created, the largest CIDR available, and the count of IP assignments made within the subnet.
6) The IP Pool — Range & Total Available IPs shows information around the different IP pools that you have set up, including the range of IP addresses, the subnet they belong to, and the number of IP addresses available within the pool.
7) The IP Assignment Detail gives you an incredibly detailed view of all IP assignments, including the subnet the IP address belongs to, whether this was a soft assignment, the associated IP pool and the range, as well as network site name and inventory model-related information, if applicable.
8) The Accounts with IP Assignments is where you can view account information for any accounts that have IP assignments made, including the account ID and serviceable address, as well as any inventory model-related information, if applicable.
9) The Network Site — IP Overview section provides details on the subnet and IP pool information relating to a network site, including details of the network site such as the ID, name, and height (in meters).
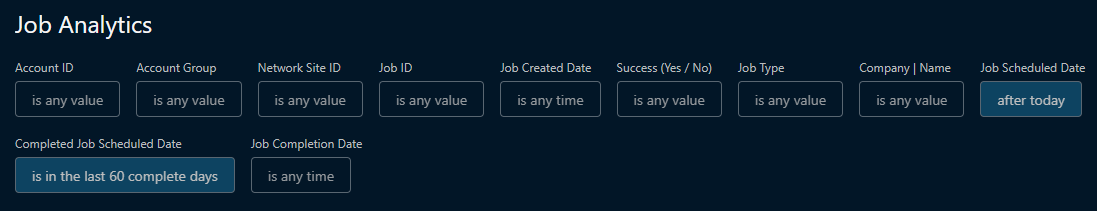
Job Analytics
The Job Analytics report provides a convenient dashboard for reviewing the statistics, details, and statuses of jobs made in your instance. This report is especially useful to your dispatch team for evaluating overall performance and efficiency levels.
Active Filters by default
Report field details
1) The Scheduled Jobs section shows the total number of jobs scheduled within the filtered time period.
2) The Scheduled Jobs Assigned to User pie chart visualizes the number of jobs assigned to each user in your instance. Each job can be clicked on for additional details on the assigned jobs.
3) The Scheduled Jobs per Type pie chart will visualize how many jobs have been scheduled, organized by job type, as defined in your instance settings. Each job type can be clicked on for more details of specific jobs.
4) The Scheduled Account Jobs table will list all jobs currently scheduled for an account, with details on the job included.
5) The Scheduled Network Site Jobs Detail table will list all jobs scheduled for a network site, with job details included.
6) The Completed Jobs segment contains additional details regarding jobs completed successfully or unsuccessfully:
a) The Completed Jobs section will show the number of jobs that have been completed within the filtered time period, whether successfully or unsuccessfully.
b) The Jobs Completed Successfully section will show the number of jobs marked as completed unsuccessfully within the filtered time period.
c) The Jobs Completed Unsuccessfully section will show the number of jobs marked as completed successfully within the filtered time period.
d) The Job Success Percentage section will look at the ratio between jobs completed successfully and jobs completed unsuccessfully as a percentage.
e) The Completed Jobs per Type table will list all completed jobs within the filtered time period, organized by job type.
f) The Completed Account Jobs table will list all completed jobs that were assigned to a customer account in your instance.
g) The Completed Network Site Jobs table will list all completed jobs assigned to a network site in your instance.
7) The Incomplete Jobs in the Past table will display all jobs that were scheduled, but were not marked as “Completed”, whether successfully or unsuccessfully.
Scheduled Events
The Scheduled Events report allows you to quickly review all events that have been or are currently scheduled to take place in your instance. This report is useful for verifying that scheduled events are being used accurately and as intended by your organization.
Active Filters by default
Report field details
1) The Scheduled Status Changes table will list all accounts with a pending scheduled status change, along with the details of the change.
2) The Scheduled Account Disconnects table will list all accounts with a scheduled disconnection.
3) The Scheduled Credit Card Payments table will list all accounts with a credit card payment scheduled to occur. This will only show payments made through the scheduled event system, not through scheduled autopay.
4) The Scheduled Bank Account Payments table will list all accounts with a bank account payment scheduled to occur. This will only show payments made through the scheduled event system, not through scheduled autopay.
5) The Scheduled New Service table will list all accounts with a new service scheduled to be added to the account, including service details.
6) The Scheduled Service Removal table will list all accounts with a service scheduled to be removed from the account, including service details.
7) The Scheduled New Packages table will list all accounts where a package is scheduled to be added to the account, including package details.
8) The Scheduled Package Removal table will list all accounts where a package is scheduled to be removed from the account, including package details.
9) The Scheduled Price Override table will list all accounts where a price override is scheduled to be put in place, including details of where the price override will be applied and the amount.
10) The Scheduled Price Override Removal table will list all accounts with a pending price override removal, including details of where the price override was applied, the amount, and the reason for removal.
11) The Scheduled One-Time Transactions will list all accounts with a one-time transaction scheduled, including the service details, how it's being applied, and the amount.
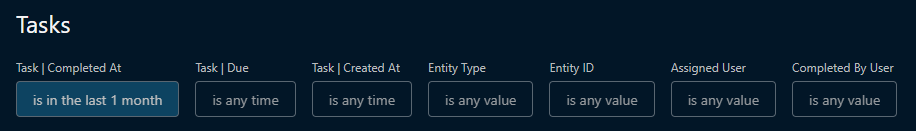
Tasks
The purpose of the Task report is to provide key insights and detailed information about the tasks in your instance, which can be attached to entities such as accounts, jobs, and tickets. Here is where you can see a breakdown of tasks by their different statuses, such as which are incomplete or have already been taken care of, as well as which ones are overdue (if associated with a due date), summary counts, and comparison by task type.
Active Filters by Default
Report Field Details
1) The Tasks Breakdown at the top of the report provides total numbers and summaries around the status of tasks (incomplete, complete, or overdue), as well as a visual comparison of the different task types based on their completion status.
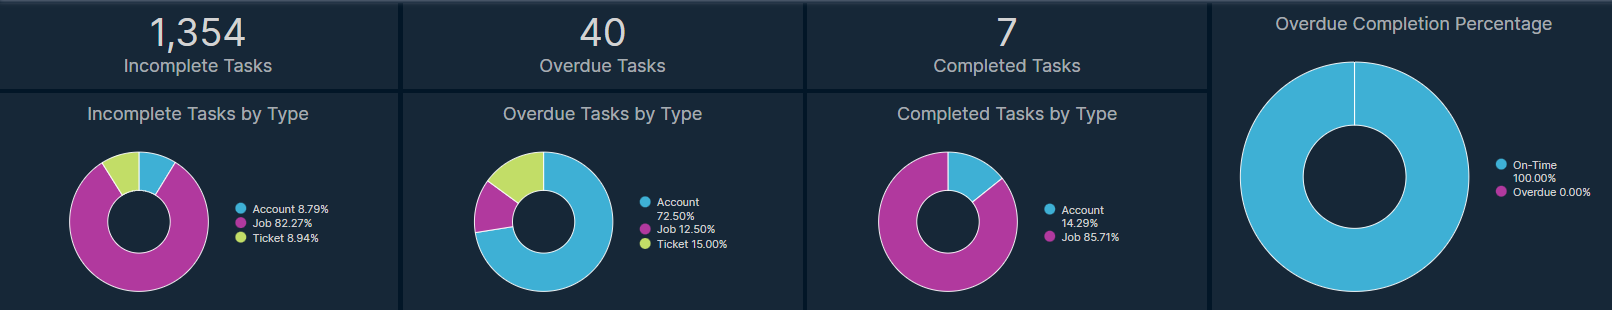
2) The Incomplete Tasks Detail section provides information on any tasks that have not been completed, including the entity type and ID they are associated with, when the task was created, as well as if there is a due date for the task, and who the assigned user is.
3) The Completed Tasks Detail is similar to the above section, except it details the tasks that have already been completed. This includes information on the associated entity, the task creation and completion dates, whether the task was past due, and who the assigned user is, as well as the user who actually completed the task.
Ticketing
The Ticketing report allows you to review the communications that have occurred between your employees and your customers while using the ticketing module in Sonar. While previous reports have looked at call logs or emails overall, the narrow focus of this report allows you to extract precise data more effectively.
Active Filters by default
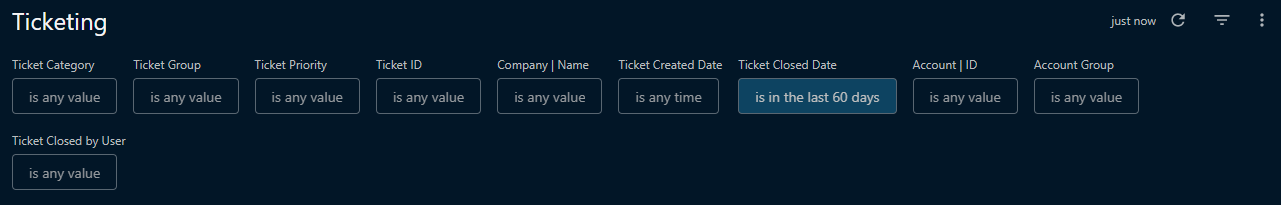
Report field details
1) The Open & Pending Tickets section will show the total number of tickets that are currently in an open, pending internal, or pending external state.
2) The Open & Pending Tickets per Priority pie chart will visualize the total number of unclosed tickets, sorted by their relative priority. Each slice of the chart can be clicked on for additional details on the tickets.
3) The Open & Pending Tickets per Group pie chart will visualize the total number of unclosed tickets, sorted by their ticket groups. Each group can be clicked on for further details of the tickets.
4) The Open & Pending Tickets per Category pie chart will visualize the total number of unclosed tickets, sorted by their ticket category. One thing to note is that a ticket may belong to more than one category, and would therefore be counted twice.
5) The Tickets Opened by Priority chart will visualize the number of tickets that have been opened in your instance, over the filtered time period.
6) The Open & Pending Tickets Detail table will list the total number of tickets in either an open or pending state, along with the recipient and ticket details.
7) The Closed Tickets segment contains details to help complete the picture of your ticketing module:
a) The Closed Tickets section will show the total number of tickets that have been closed within the filtered time period.
b) The Closed Tickets per Priority pie chart will visualize the total number of tickets closed, within the filtered time period, separated into their priority levels. Each slice of the chart can be selected for additional ticket details.
c) The Closed Tickets per Group pie chart will visualize the total number of closed tickets, separated into the various ticket groups. Each slice can be clicked on to obtain more details about the tickets in each group.
d) The Closed Tickets per Category pie chart will visualize the total number of tickets that have been closed, within the filtered time period, separated into their various ticket categories. One thing to note is that a ticket may belong to more than one category, and would therefore be counted twice.
e) The Median Closure Time section will show you the median time it takes for your team to close tickets.
f) The Longest Closure Time section will show the longest amount of time before a ticket was closed.
g) The Tickets Closed by Priority chart will display the number of tickets closed month by month, separated by their priority.
h) The Closed Ticket Detail table will list all closed tickets in your instance, along with the ticket details.
Financials Category
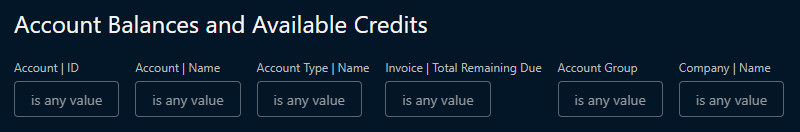
Account Balances and Available Credits
The Account Balances and Available Credits report is a simple way to review overall balances and credits on customer accounts, without getting too far into the weeds of adjustment details, credit and debit charges, revenue, or invoices. The available credits will be the sum of all unapplied discounts and unapplied payments.
Active Filters by default
Report field details
1) The Available Credits by Status graph will display the overall available credits on your accounts, organized by status and by company.
2) The Available Credits and Remaining Balances table will provide details about the accounts in your instance, along with their current credits and remaining balances.
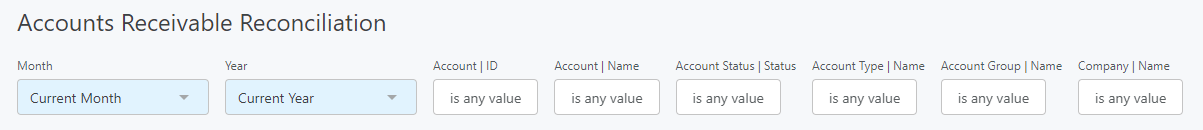
Accounts Receivable Reconciliation
This report is designed to simplify the complex date filtering normally required, and provides a fast and easy way to reconcile monthly Accounts Receivable against your transactions.
Active Filters by Default
Report field details
1) The Accounts Receivable Reconciliation table shows you a reconciliation summary per account, with details from account transactions used to calculate the ending AR using the following formula:
Starting AR + Debits + Taxes - Discounts Applied - Payments Applied + Voided Credits = Ending AR2) The Transaction Details table contains all the individual invoiced transactions that occurred during the month. This includes all debits, taxes, discounts applied, payments applied, and voided credits from the summary.
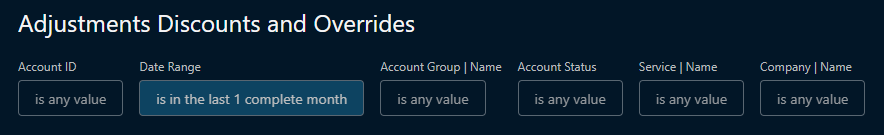
Adjustments, Discounts, and Overrides
The Adjustments, Discounts, and Overrides report allows you to review the different ways you're affecting the default price of services being applied to customer accounts. Because these price changes are applied on an individual account basis, having a single dashboard to track them all makes it convenient to review all this information.
It's important to note that Discounts are separated into 2 categories:
- Applied Discounts, where the discounts have already been applied to an invoice (and are displayed as credits with a creditable_type of “discount”).
- Unapplied Discounts, where the discounts show up on the customer account under “Available Credits”.
Active Filters by default
Report field details
1) The Total Credit Adjustments section will list the total number of adjustments that have been applied as credits to customer accounts.
2) The Total Debited Adjustments section will list all adjustments applied as a debit to customer accounts in your instance.
3) The Credited Adjustments by Service pie chart will list the dollar amount of adjustments applied to customer accounts, organized by service. Each section of the pie chart can be clicked on to receive additional details about the service applications.
4) The Debited Adjustments by Service pie chart will visualize how each type of adjustment service was applied as a debit to customer accounts. Each slice can be clicked on to receive further details regarding the adjustment services.
5)The Credit Adjustment Detail table will list out the specific details about all applied credit adjustments.
6) The Debited Adjustment Detail table will list information regarding each debited adjustment applied to customer accounts.
7) The Discounts segment will allow you to review how discount services are being used within your instance. Any service being applied to an account as a credit will be shown here as part of the discount totals and details:
a) The Total Discounts section will show the total amount of all credits that have occurred within the filtered time period. This total includes both applied and unapplied discounts. Adding Total Discounts Applied and Total Discounts Unapplied together may not equate this value.
b) The Total Discounts Applied section will show you the total amount for all credits that have been applied against an invoice within the filtered time period.
c) The Total Discounts Unapplied section will show you the total amount for all credits that have yet to be applied against an invoice but were generated within the filtered time period. This section does not look at historical data and will not show you if a discount was unapplied during the date range selected.
d) The Top 10 Discounts pie chart will allow you to quickly determine the 10 services most often being applied as a credit to customer accounts in your instance. Each section of the pie can be clicked on for additional details about the specific transactions.
e) The Top 10 Applied Discounts pie chart will visualize the 10 services most often applied as a credit to a customer account and used against an invoice. Each section of the pie can be clicked on for additional details about the specific transactions.
f) The Top 10 Unapplied Discounts pie chart will visualize the 10 services most often applied as a credit on a customer account, but not applied against an invoice. Each section of the pie can be clicked on for additional details about the specific transactions.
g) The Discounts Detail table will provide a breakdown of all transactions where services were applied as a credit on an account. This table includes the service details, account information, and discount origination information. These discounts can be created from reversals of debits and credits (recurring and one-time).
h) The Discounts Applied bar graph will visualize the $ value of all discount transactions month-over-month, separated into the distinct service types where the credit was applied. This section displays all the discounts that have been applied to an invoice, whether they are reversed discounts or unreversed and can also be created from reversals of debit charges or created from recurring and one-time credit adjustments. Discounts, once applied to an invoice, become credits.
i) The Discounts Applied Detail table will provide a breakdown of all credit transactions that were applied to an account and against an invoice. This table provides account details, discount origination details, and total credit amounts.
j) The Discounts Unapplied bar graph will visualize the amount of all discount transactions that have yet to be applied to an invoice month-over-month, separated into the distinct service types where the credit was generated and is available to customers as a credit amount. This section does not look at historical data and will not show you if a discount was unapplied during the selected date range.
k) The Discounts Unapplied Detail table will provide a breakdown of all transactions where services were applied as a credit on the customer account, but have yet to be used against an invoice and remain as an available credit. This table includes the service details, account information, and discount origination information. This section does not look at historical data and will not show you if a discount was unapplied during the selected date range.
l) The Price Overrides table will provide a breakdown of all services that have had their price individually modified when added to a customer account. This table provides account information, service details, and price override details.
m) The Tax Overrides table will provide a breakdown of all accounts that have a tax override applied, including details on the overridden tax and rate details.
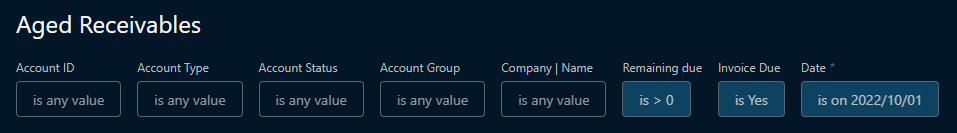
Aged Receivables
If you've used financial software in the past, then you're likely familiar with Aged Receivables (AR). This report allows you to distinguish accounts based on the length of time an invoice has been outstanding on customer accounts. Any voided credits are considered in the calculation by reflecting the amount and the date it was voided. This report will be displayed per time range tier (Current, 0–30 days, 31–60 days, 61–90 days, 90+ days), and represents invoiced revenue that is expected to be paid. “Current” refers to amounts that have been invoiced, but have yet to reach the invoice due date, while the other tiers represent days from the due date.
Active Filters by default
Report field details
1) The AR: Top 50 Highest Account Groups pie chart will show the top 50 account groups with invoices outstanding. Each section of the chart can be clicked on to receive further details about the accounts.
2) The AR: Top 50 Highest Account Types pie chart will show you the top 50 account types with invoices outstanding. Each section of the chart can be clicked on to receive further details about the accounts.
3) The AR: Top 50 Highest — Account Status pie chart will show you the top 50 account statuses with invoices outstanding. Each section of the chart can be clicked on to receive further details about the accounts.
4) The Aged Receivables including Current Due section contains various charts and tables to shed light on your accounts receivable status:
a) The Aged Receivables Summary with Current Due table shows details for any accounts that currently have amounts owing, broken down by the different tiers.
b) The Aged Receivables by Account Group table shows the total outstanding amounts by account group, broken down by the different tiers.
c) The Aged Receivables Detail by Invoice table provides further information for each invoice that is currently outstanding.
5) The Aged Receivables as of Today Based From Due Date section contains information that will help you dive deeper into your Aged Receivables, based on the due date of customer invoices:
a) The Aged Receivable by Aged Tier pie chart provides a visualization of what tier your aged receivables fall under. Each slice can be clicked on for more information on the outstanding invoices.
b) The Total Amount 30+ Days Overdue section shows the total amount outstanding that is 30 or more days overdue.
c) The Delinquency Trend by Invoice Month graph provides a visualization of the overall trend of delinquent invoices within your instance, broken down by invoice month.
d) The Aged Receivables Detail table provides details of accounts that have outstanding invoices, broken down by tier.
e) The Aged Receivables by Account Group table provides details on outstanding invoices per tier, broken down by account group.
f) The Aged Receivables by Account Type table shows details on outstanding invoices per tier, broken down by account type.
Anchor/Linked Dashboard
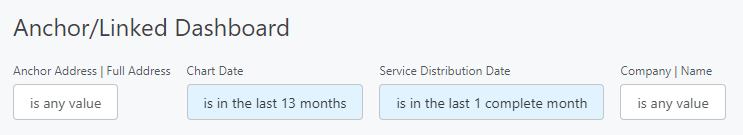
The Anchor/Linked Dashboard report is all about arming you with the information you need to ensure your linked addresses are being adequately serviced, paying their bills on time, and taking advantage of the services you offer.
Active Filters by default
Details
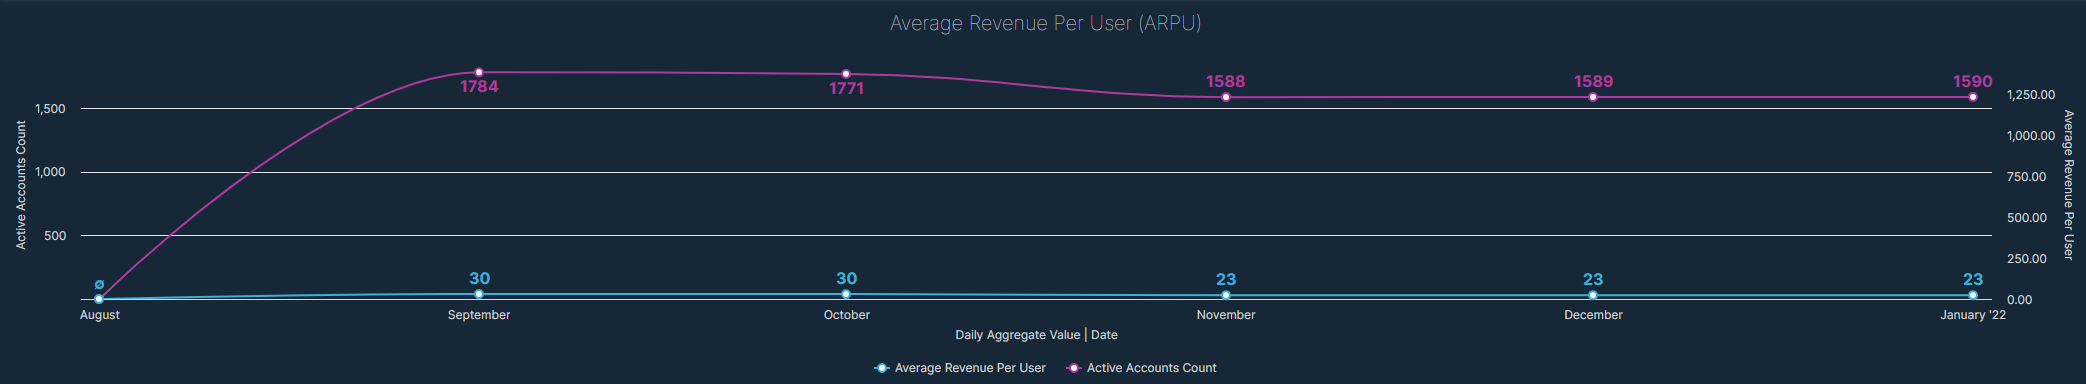
1) The Average Revenue Per User chart displays your earned revenue, divided by the number of users, relative to subscribers on Anchor and Linked accounts. This chart breaks down these amounts month over month.
2) The Invoiced Revenue chart displays all invoiced revenue, divided into two categories - revenue from all Anchor and Linked accounts, and revenue specifically generated from Anchor subsidies.
3) The Delinquent Receivables pie chart will display, in two sections, the percentage of users who are delinquent and the percentage who are not. This value is relative to Anchor and Linked accounts exclusively.
4) The Accounts Receivable section will show you the total dollar amount of any due invoices generated for Anchor/Linked accounts.
5) The Delinquency Rate section will show you the total percentage of accounts, relative to the total number of accounts belonging to Anchor and Linked accounts, that are delinquent. This value may not match the Delinquent Receivables value, as it will be affected by your Anchor Delinquency Billing Default.
5) The Take Rate section tracks the percentage of Linked addresses that are associated with an account and that account subscribes to a service, versus the total number of available Linked Addresses.
6) The Service Table table provides a detailed breakdown of subscribed accounts associate with a Linked Address, and which service(s) they subscribe to.
Delinquency
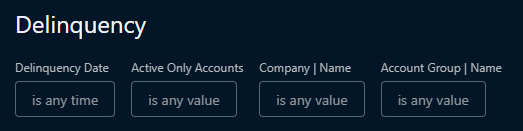
The Delinquency report provides a bird's-eye view over accounts with an outstanding invoice. Delinquency in Sonar is recorded regardless of status switching, which means this report is a guaranteed way to quickly assess accounts and their standing.
Active Filters by default
Report field details
1) The Delinquent Accounts section will show you the total number of delinquent accounts in your instance.
2) The Delinquent Accounts Past Year section will show you the total number of accounts in your instance that have been delinquent in the last year.
3) The Delinquent Invoices section will show you the total number of delinquent invoices in your instance.
4) The Delinquent Balance section will show the total dollar value of delinquent invoices and charges on across the filtered list of accounts in your instance.
5) The Delinquent Invoices by Days Overdue pie chart will visualize the total number of delinquent invoices and how long they've been overdue, organized by 30-day periods and by company. Each slice can be clicked on for more information on the delinquent accounts and invoices.
6) The Delinquent Invoice Detail table will provide you with more detailed information on the delinquent invoices and accounts in your instance.
7) The Delinquency by Invoice, Service, and GL Code table will list all Delinquent Invoices, along with the account's service details, and transaction GL code.
Due Invoices
The Due Invoices report allows you to narrow your overall financial focus to invoices that are currently due. This view is useful when preparing for due payment notifications, or for anticipating an increased call volume in situations where large amounts of invoices are due.
Active Filters by default
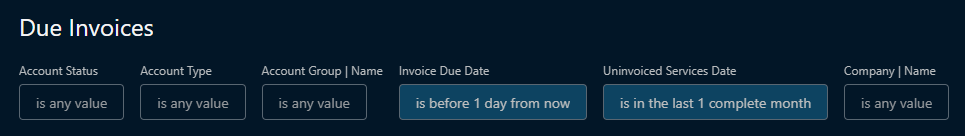
Report field details
1) The Total Due section will show you the total amount due, based on the currently due invoices.
2) The Due Invoices Detail table will provide you with information about the invoices that are currently due and the accounts they belong to.
3) The Uninvoiced Services section provides a few different tables to further drill into this data:
a) The Total Uninvoiced Services section will show you the value of all service transactions charged to accounts that have yet to be invoiced.
b) The Uninvoiced Services pie chart will visualize the number of each service type applied to a customer account, but that has not yet been applied to an invoice. Each slice can be clicked on to obtain additional details.
c) The Uninvoiced Services Detail table will list all services applied to an account but not yet invoiced, along with the details of the account it's been applied to.
Financial Overview
The Financial Overview is one of the main dashboards to use when you need a large overall view of your organization's finances. While other reports have focused on individual portions of how your finances are being affected, the Financial Overview report provides a broad look with lots of information.
For this report, it's important to distinguish between invoiced and earned revenues.
- Invoiced revenue is simply the total amount of debit transactions on invoices at the end of the month.
- Earned Revenue is the total amount of earned revenue by month. The smallest fractional unit for reporting earned revenue within Sonar is 1 month. So if you don’t do any multi-month billing, then your earned and invoiced revenue should be the same.
- Example: A bill of $1200 on a 12-month invoice billed in January, and it is currently June, will reflect $600 of total earned revenue. Each month will report $100 of earned revenue for this invoice.
- The Invoice Revenue Report is founded on the earned revenue date, which, for single-month invoices, corresponds to the invoice date. In the case of multi-month invoices, the debits are divided into monthly portions, with one portion being recognized as earned for every month that the invoice remains valid, starting from the invoice date. Please note that the Invoice Revenue Report only displays revenue as of the invoice date, rather than revenue based on the bill date.
- In Sonar, “Earned Revenue” denotes the revenue a company has earned and acknowledged for providing goods or services within a specific period. This figure does not factor in deductions, taxes, or other expenses. Instead, it reflects the invoiced debits recognized as earned on the defined earned revenue date.
For example: An invoice may be billed on May 1st, but the invoice date would be for June 1st if the client is receiving services for the month of June. As per the defined earned revenue date, the revenue would be considered earned on June 1st.
Active Filters by default

Report field details
1) The Average Revenue Per User (ARPU) plot graph allows you to visualize your ARPU month over month for the past 6 months. Average Revenue Per User (ARPU) is determined each day by taking recurring revenue and dividing by the number of active accounts. This value is determined daily, and the graph displays the average ARPU for the month.
2) The Invoiced Revenue this Month section will show the amount you've invoiced in the current calendar month.
3) The Invoiced Revenue per Period section will display the amount on invoices within the filtered time period.
4) The Invoice Revenue Transactions plot graph will show you a record of transactions that have occurred on invoices within the filtered time period.
5) The Earned Revenue this Month section will show you the revenue you've earned in the current calendar month.
6) The Earned Revenue per Period section will show you the revenue you've earned within the filtered time period.
7) The Earned Revenue Transactions plot graph will provide a record of transactions and earned revenue within the filtered time period.
8) The Payments this Month section will show you the amount you've received in payments during the calendar month.
9) The Payments Received per Period will show you the amount you've received in successful payments within the filtered time period.
10) The Payments Received plot graph will provide a record of successful payments received month-over-month within the filtered time period.
11) The Discounts this Month section will list the total amount of discounts applied to customer accounts during the current calendar month.
12) The Discounts per Period section will list the total amount of discounts applied on customer accounts within the filtered time period.
13) The Discount Transactions plot graph will list the discounts that have been applied to invoices and their amounts month-over-month within the filtered time period.
14) The Accounts Activated this Month section will list the total number of accounts activated for the first time within the calendar month.
15) The Accounts Activated within Period section will list the number of accounts activated for the first time within the filtered time period.
16) The Active Accounts and Activations plot graph will show you the current number of active accounts and account activations month-over-month.
17) The Delinquency plot graph will show the number of delinquent accounts and the percentage of accounts delinquent relative to the total.
18) The Accounts Receivable plot graph will show your month-over-month accounts receivable within the filtered time period.
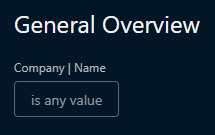
General Overview
The General Overview dashboard provides another large view, but rather than being focused on your organization's financials, it allows you to review the general operation on a day-to-day basis. Information on your instance's jobs, accounts, and tickets will be seen here.
Active Filters by default
Report field details
1) The Billing and Account Statistics segment provides a brief look at the general billing and account details of your instance across all companies:
a) The Active Accounts will show you the total number of active accounts in your instance.
b) The Earned Revenue this Month section will show you overall revenue for the current calendar month.
c) The Delinquent Accounts Past Year will show you the total number of accounts that have gone delinquent over the past 12 months.
d) The Invoiced Revenue This Month will show you the amount of revenue invoiced within the current calendar month.
e) The Total Individual Accounts will show you the total number of accounts in your instance, active or inactive.
f) The Accounts Receivable Total will provide the total of expected revenue based on your accounts receivable, which means uninvoiced and un-debited services.
2) The Today segment will reflect current details as of the current date and time:
a) The Accounts Created section will show you the number of accounts created on the current date.
b) The Accounts Activated section will show you the number of accounts activated within the current day.
c) The Accounts Billed section will show you the number of accounts billed within the current day.
d) The Jobs Scheduled section will show you how many jobs were scheduled within the current day.
e) The Jobs Completed section will show you how many jobs were completed within the current day.
f) The Jobs Failed section will show you the number of jobs that were failed within the current day.
g) The Tickets Created section will show you the number of new tickets created within the current day.
h) The Tickets Closed section will show you the number of tickets that were closed within the current day.
i) The Invoice Print Batch Count will show you the number of invoices set to be printed within the current day.
3) Unique to the General Overview is a section called Related Report Detail Dashboard Links, which is linked to other useful reports that build on the information contained within this report:
a) A link to the Account Details report.
b) A link to the Job Analytics report.
c) A link to the Ticketing report.
d) A link to the Invoiced Transactions by GL report.
e) A link to the Invoiced Revenue report.
f) A link to the Delinquency report.
g) A link to the Aged Receivables report.
Invoiced Revenue
The Invoiced Revenue report takes a very focused look at exactly what it says in the title. Compared to the Financial Overview report, this may be less useful to every audience, but when running accounting reports or migrating your data into other accounting software, the invoiced revenue report is necessary to ensure the smooth operation of your organization's financials.
While this report is named “Invoiced Revenue” the way it pulls its data means it is more accurate to consider it the “Earned Revenue” report.
Active Filters by default
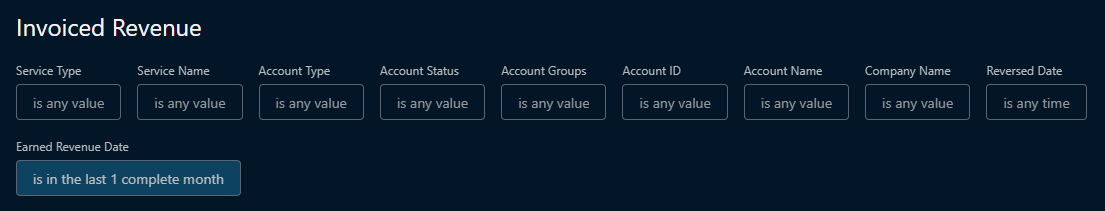
Report field details
1) The Invoiced Revenue by Service pie chart allows you to visualize how much each service is contributing to your overall invoiced revenue. Each slice can be clicked on to obtain further details about how each service is being applied in your instance.
2) The Invoiced Revenue by Account Type pie chart organizes your total invoiced revenue metric by account type. Each slice can be clicked on for additional details on which accounts fall under that type, and how they contribute to invoiced revenue.
3) The Invoiced Revenue by GL pie chart visualizes each GL Code as a portion of your invoiced revenue, and how it applies to the total. Each slice can be clicked on for additional details on the services that fall under that GL code.
4) The Invoiced Revenue by Group pie chart visualizes your total invoiced revenue metric by account group. Each slice can be clicked on to obtain more information about the accounts within the group.
5) The Invoiced Revenue by Service table will list the details of services and how much revenue the service is contributing to your organization.
6) The Invoice Detail table will provide you with a detailed breakdown of the invoices generated on accounts, including their multi-month billing status, general ledger code, reversal status, and revenue.
7) The Invoiced Revenue by Group table breaks down your revenue by account group.
8) The Invoiced Revenue by Account Group by Service table breaks down your organization's invoiced revenue by both account group and service.
9) The Invoiced Revenue by Service and Subscriber Count table allows you to view your invoiced revenue by breaking it down into how many of your subscribers are on each of your services.
10) The Invoiced Revenue by GL Code table allows you to review your total invoiced revenue based on the GL Code each service is classed under.
11) The Invoiced Revenue Summary by Account table will list all accounts in your instance alongside the revenue earned from each account.
Invoiced Transactions by GL Code
The Invoiced Transactions by GL Code report allows you to more concretely explore the various transactions, both debits and credits, occurring in your instance through the lens of the general ledger codes you've created for your instance.
Active Filters by default
Report field details
1) The Earned Revenue by GL Code table allows you to see how much revenue each segment of GL Codes is earning.
2) The Invoiced segment allows you to view the details of which invoiced discounts and invoiced debits occurred within the filtered time period:
a) The Invoiced Debits by GL Code table will show the total amount of invoiced debits by GL code. Note that no additional calculations are performed here, so what you see on the invoice is what you will see here. This means that if you have a multi-month invoice, the full invoiced amount is reported at once, on the invoice date.
b) The Invoiced Discounts by GL Code table is where you will find the total amount of credits with creditable_type being “Discount” for each GL code.
Payments
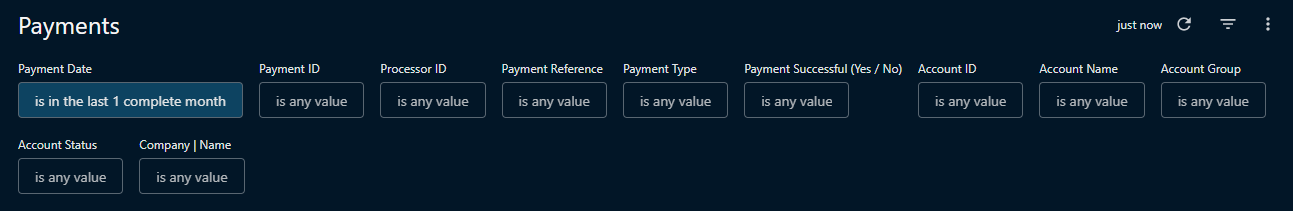
The Payments report allows you to review the details of all payments you've received from customers in your instance. This report will break down the payment details in a way that enables you to review specific payment dates, payment methods, or payment amounts, in addition to providing you with the details of declined charges.
Active Filters by default
Report field details
1) The Account Payments by Type pie chart will show you how much each supported payment method was used relative to the total within the filtered time period. Each slice can be clicked on for additional information on the specific transactions.
2) The Payments by Type bar graph will show you both the unearned revenue and unreversed payment amount of each supported payment method. Each bar can be clicked on for more information about the specific transactions.
3) The Payment Details table provides you with a breakdown of each transaction in your instance listed as a payment, along with the account and payment method details.
4) The Applied Payments table allows you to review which payments were applied to invoices, along with details of the invoice and account where the payment was applied.
5) The Declined Charges table will list all payments that failed to charge, along with information about the account, details about the error message, and the payment method.
Refunds and Reversals
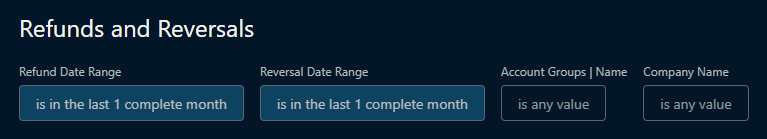
The Refund and Reversals report functions as a companion report to the Payments report, where rather than focusing on the money coming in as debit transactions, this report focuses on the money going out as transactions that have been reversed or credited back as a refund.
Active Filters by default
Report field details
1) The Total Reversals section will display the value of all reversals performed in your instance within the filtered time period.
2) The Total Refunds section will display the value of all refund transactions performed in your instance within the filtered time period.
3) The Reversals by Type pie chart will show you which payment methods were reversed by percentage, organized into distinct charts for each company in your instance. Each slice can be clicked on for additional details about the transactions.
4) The Refunds by Type pie chart will show you which payment methods were refunded by percentage, organized into distinct charts for each company in your instance. Each slice can be clicked on for additional details about the transactions.
5) The Reversal Details table will provide you with a detailed breakdown of the reversal transactions in your instance, along with the account and amount details.
6) The Refunds Detail table will provide you with a detailed breakdown of the refund transactions in your instance, along with the account and amount details.
Revenue Growth and Contraction
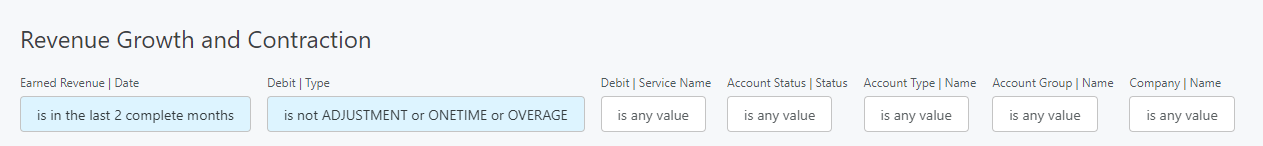
The Revenue Growth and Contraction report looks at revenue within your instance and how it changes month over month. By default, only recurring revenue is included, but filters may be adjusted to include non-recurring revenue. The report provides a breakdown of the $ amount and quantity of debit services “earned” in the past 2 months and compares the differences. This uses earned revenue, so the values are not distorted by multi-month billing.
Active Filters by default
Report field details
1) The Month-over-Month Revenue graph will show you your total monthly revenue each, plotting a point at the total amount each month.
2) The Monthly Revenue Change by Service table will list which services experienced a change in quantity, and how that change affected your monthly revenue.
3) The Revenue & Service Detail table provides a list of all accounts in your instance and how that account affects your revenue.
4) The Service Distribution table provides a detailed breakdown of the available services in your Sonar instance and show their change in subscriptions and their distribution on accounts month-over-month.
Sonar Billable Accounts
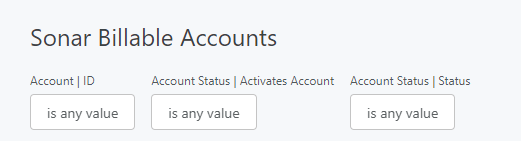
The Sonar Billable Accounts report can be used to determine how your instance will be billed by Sonar before billing runs.
Active Filters by default
Report field details
1) The Billable Accounts section will display the total number of Billable Accounts in your instance.
2) The Inactive Billable Accounts section will list the number of accounts that have an inactive account status, but continue to meet other requirements to remain billable (or were deactivated within the current billing cycle and will still be charged)
3) The Billable Accounts by Status pie chart will break down the billable accounts total by their associated account type.
4) The Billable Account Details table will provide a details breakdown of all accounts that are currently billable in your instance. This includes details on the account activation status of their current Account Status, and Inventory assignment details.
sonarPay Disbursements
See the sonarPay Disbursements article.
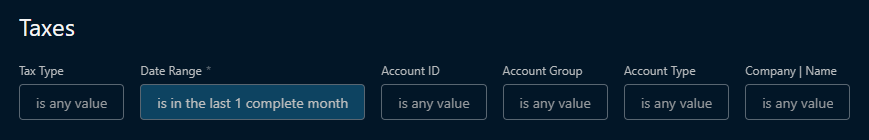
Taxes
The Taxes Report breaks down the transactions occurring in your Sonar instance in a way that allows you to dive deep into exactly how taxes are applied to each service, taxable transactions, taxes received, taxes credited, tax exemptions, and untaxed transactions.
Active Filters by default
Report field details
1) The Taxable Invoice Revenue section will provide you with the total amount of revenue that was both taxable and has already been invoiced within the filtered time period.
2) The Total Taxable Credits and Discounts section will provide you with the total amount of discounts and credits applied to customer accounts that were taxable within the filtered time period.
3) The Net Total Taxable Amount section will show you the overall total value of transactions that are taxable in your instance.
4) The Total Taxes Received section will show you the overall amount you've received in taxes from all transactions in your instance within the filtered time period.
5) The Total Taxes Credited section will show you the overall amount of taxes that were credited to customer accounts, either as direct credits or as the result of reversals or refunds.
6) The Net Total Taxes section will show you the overall amount of taxes that have been collected over the course of transactions within the filtered time period.
7) The Total Taxes Received by Tax Type table will break down the amount of taxes you received over the course of transactions, by which tax type collected the taxes.
8) The Total Taxes Credited by Type table will break down the overall amount of taxes that were credited, organized by tax type.
9) The Net Taxes by Tax Type table will break down the overall amount of taxes that were received when factoring in the debited versus credited taxes, by tax type.
10) The Tax Detail table will break down every debited tax transaction that occurred in your instance within the filtered time period.
11) The Tax Credit Detail table will break down every credited tax transaction that occurred in your instance within the filtered time period.
12) The Tax Exempt Invoiced Revenue section will show you the total amount of invoiced revenue that was marked as tax-exempt within the filtered time period.
13) The Untaxed Debits Detail table will list out all transactions that occurred on accounts in your instance that had no taxes applied to it, including account information and the amount of the transaction.
Uninvoiced Transactions
The Uninvoiced Transactions report can be used to quickly locate and correct any transactions that have not been applied to an invoice in your Sonar instance. This report should be checked periodically, especially if your accounts have an Anniversary Invoice Day, as it can be used to inform yourself on what to expect as invoices get generated. While most of this data is available across other reports, the information is consolidated here, making it easier to take action.
This report can also be used to identify bad debt. For example, if you have a disproportionate amount of uninvoiced debits on Inactive accounts, you would need to manually create and balance the invoice to write off the potential bad debt.
Active Filters by Default
Report Field Details
2) The Uninvoiced Debits section will show you the total amount of all uninvoiced debits in your instance, across all accounts, in dollars.
3) The Uninvoiced Payments section will show you the total amount of all uninvoiced payments made by customers in your instance, across all accounts, in dollars.
4) The Uninvoiced Discounts section will show you the total amount of all uninvoiced discounts across all accounts in your instance, in dollars.
5) The Uninvoiced Debits Detail table breaks down every uninvoiced debit in your instance, providing details about the transaction and the account.
6) The Uninvoiced Payments Detail table breaks down every uninvoiced Payment in your instance, providing details about the transaction and the account, including the total amount that was paid, and the amount remaining.
7) The Uninvoiced Discounts Detail table breaks down every uninvoiced Discount in your instance, providing details about the transaction and the account.