Table of Contents
Being Cloud Native
Read Time: 23 mins
Defining Cloud Native
‘Cloud native’ is a term that is used frequently nowadays, but what does it mean? The Cloud Native Computing Foundation defines it as follows:
Cloud-native technologies empower organizations to build and run scalable applications in modern, dynamic environments such as public, private, and hybrid clouds. Containers, service meshes, microservices, immutable infrastructure, and declarative APIs exemplify this approach.
These techniques enable loosely coupled systems that are resilient, manageable, and observable. Combined with robust automation, they allow engineers to make high-impact changes frequently and predictably with minimal toil.
Web applications are extremely complex beasts nowadays. Long gone are the days of applications of any significant size running on a simple single server, with a web server, a small database, and a single language powering it (a specific configuration of which was once so ubiquitous, it had its own acronym, ‘LAMP’.)
Sonar is a large, dynamic application that runs in the cloud (on Microsoft Azure, to be specific). None of our code is wired to any of the infrastructure itself, which means we can deploy new features and systems rapidly, and apply changes or roll them back seamlessly and transparently, with no customer impact.
Deploying Sonar
Sonar utilizes a number of different components, many of which are somewhat interchangeable in their utilization. For example, we use Redis as both a caching engine, and a job queuing system. If, at some point, we decide it makes more sense to use the Azure Service Bus as our job queuing system, we can easily transition to that without any real impact on our day to day operations, or our code base. To understand how this all works, let’s start with the application itself — the underlying source code that drives Sonar.
Getting code into production
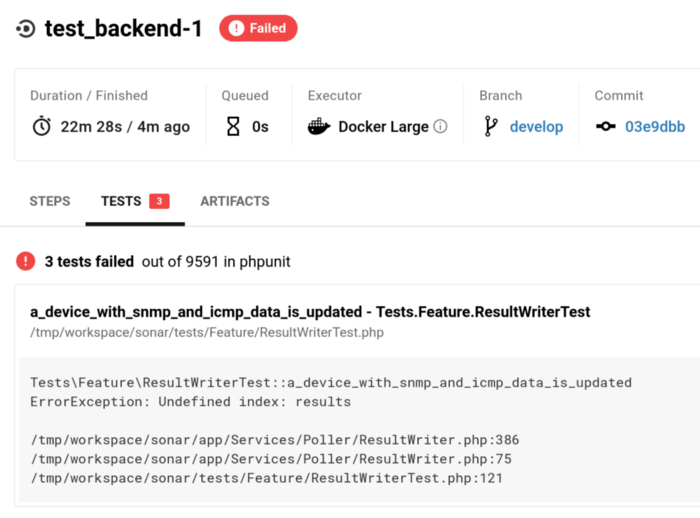
Our code base, like most code bases around the world nowadays, lives in a Git repository. The code base is well structured and has tens of thousands of automated tests that are run every time a change is made to ensure nothing breaks and that we don’t have any regressions. These tests are automatically run through a Continuous Integration process, using CircleCI. If we have a failure, we can see what failed, why, and who broke it.
Once all the tests pass, the developer working on the change opens a Pull Request. This signals to the other developers that this change is ready for review.
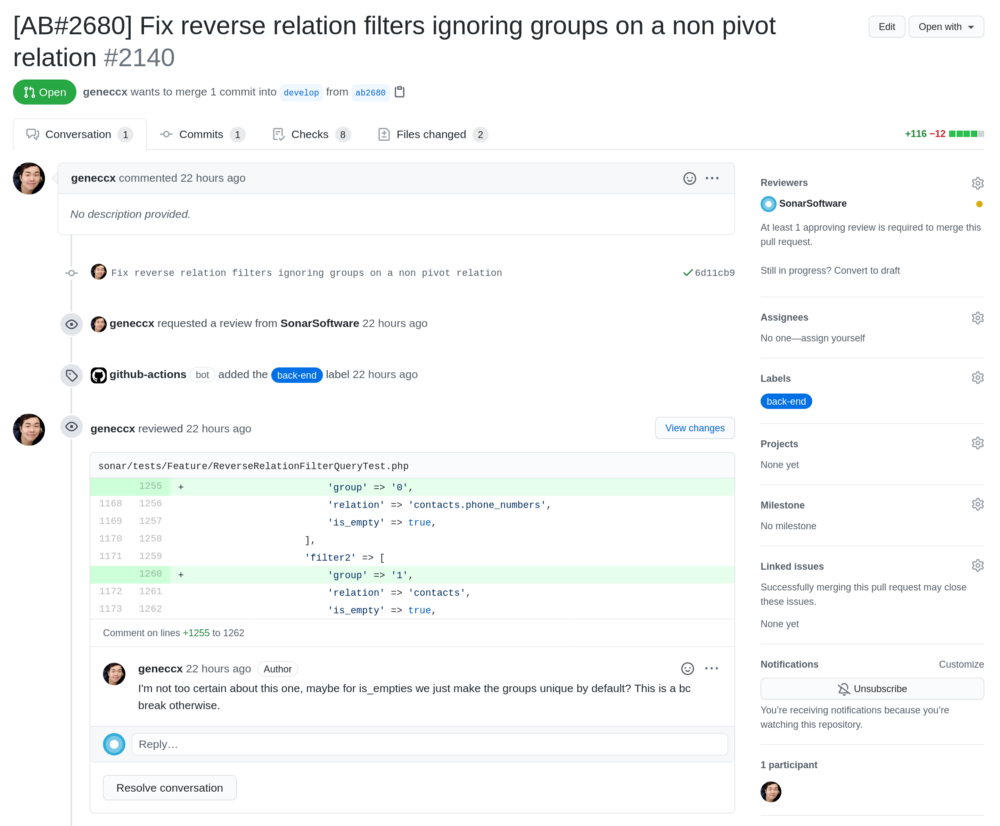
Before this code is ever deployed into production, another developer must review it and approve it. This gives us a second set of eyes on every change, and helps catch issues that wouldn’t necessarily be caught in a test, like a change with a negative performance impact, or a subtle bug that wasn’t thought of by the original developer.
After the pull request is approved and merged, the code is deployed into a staging environment. This environment mirrors our live, production environment, which helps us catch bugs that may only affect the application in production. Our QA team will review these changes in the staging environment and make sure they don’t notice any additional bugs.
Once that’s done, we can move on to deploying the code into production. This is one of the first major steps where us having a cloud architecture makes getting changes into production significantly simpler than typical, legacy methods. In order to explain how we do this, let’s take a trip back through time and think about how software used to be deployed.
A story of a whale
A long time ago, companies deployed software onto bare metal servers. You’d purchase a server from Dell, HP, or some other vendor, rack it in your data center, or in a closet, or a cabinet somewhere, and then use it like a regular computer. You’d install whatever operating system the vendor required on it, do the necessary setup, install your application, and away you’d go.

This sucked, for a variety of reasons. Often, these software platforms demanded a clean server, or a specific operating system version, or some other requirement that made it very hard to run multiple applications on the same server. This meant an enterprise would often end up with tens, or hundreds of servers, and a vast infrastructure just to run their business. In a previous job, I worked for a large cable operator in the USA, and many of my customers were major enterprises. It was not uncommon for me to visit their facilities and find massive server farms inside their buildings that had huge teams on staff 24/7 to manage them. Secondly, it wasn’t always easy to back up these servers or run a standby in parallel, which meant if you had a failure, you’d have an outage until you could get the server back up and running or get a replacement in place.
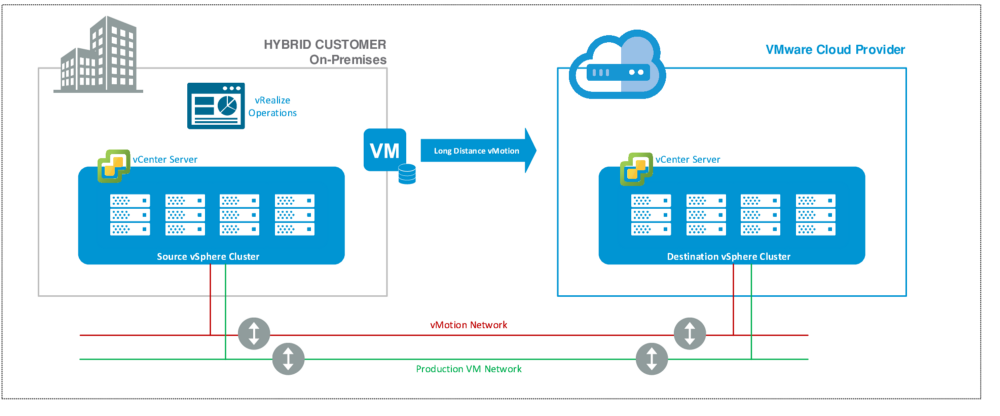
The first improvement to this system was virtualization. In the early 2000s, virtualization took off in a huge way, driven by companies like VMWare. The promise of virtualization was an end to the mess of bare metal servers that enterprises were running. Virtualization allowed an operator to create ‘virtual servers’ spread across bare metal servers. These virtual servers appeared to the applications and operating system running inside them to just be the same kind of server they were used to running on, but they were not. Not only did this make it much easier to bring up new servers for applications, it also meant you could move a virtual server around in real time — if one physical server failed, you could just migrate it to another one. If you needed more resources, you could just add more servers to your cluster. Nowadays, this has even progressed to allowing virtual machines to be migrated from a virtualization environment in your premise to the cloud itself — Microsoft has a product called ExpressRoute that aims to make their Azure cloud an extension of your local network.
Virtualization had its problems though. Imagine you needed fifty virtual machines, all running the same operating system. There was no real way to ‘share’ the operating system between them — each VM has its own operating system image, which adds overhead in both resources and storage. Bringing up new VMs was also just as time consuming as bringing up new servers in terms of operating install or applying an image — if you needed to deploy a new VM, it took time. Similarly, if you needed to upgrade the operating system on all your virtual machines, you’d have to do each one individually, deal with the downtime/impact of doing so, and take copious backups in case you had to roll back.
As cloud computing began to take off, the lack of portability of virtual machines was also a problem. As you can see in the diagram above, the cloud provider that allows migration of virtual machines from on premise is a ‘VMware Cloud Provider’. You are often locked into an ecosystem at the enterprise level, and it’s not cheap.
The whale appears
In 2013, Docker appeared on the scene, touting the benefits of containerization. While containers as a concept had been around for a long time prior to this, Docker offered a whole ecosystem of container management options, and it was at this time that containers began to explode in popularity. Even if you’ve never used Docker, it’s likely you’ve seen the logo around.
The benefit of containers over virtual machines is huge. Rather than being a self contained virtual machine with its own operating system, a container sits on a server and its host OS. Each container shares the underlying operating system and, often, other applications on the OS. In comparison to a virtual machine, a container can be tiny — megabytes vs tens or hundreds of gigabytes — and they can be booted in seconds.
The upside of this to applications in the cloud in particular is enormous. Rather than having to manage multiple operating systems across multiple VMs, and figure out an upgrade solution, we can just deploy containers on top of a single OS, and upgrade that one. If we need more resources, we can just deploy more containers. If we need to replace code in production, we can deploy new containers with the new code onto the same servers, and destroy the old containers. This finally brings us back to the deployment of Sonar code to the cloud!
Continuous Delivery
Sonar operates using a continuous delivery model. This means we can (and do) deploy code directly without having specific versions or build dates. Because our code flows through so many testing phases, once it makes it to the end, we feel very confident about deploying it into production.
We do this by automatically building containers for the different services that we need to run Sonar as part of our continuous delivery system. A container is built for the web and API services. A container is built for the websocket/real time services. A container is built for the scheduler system, and the job processing systems. With a single button click, these are all deployed into production, and once they’re all up and running, we seamlessly flip the production environment over to these new containers and tear down the old ones. This also means a rollback is just as easy if we need to — we just deploy an older container and flip back. However, the thing with containerized deployments is, at the end of the day, you still need servers underlying the whole infrastructure to run the containers on top of, which need to be managed. That’s when we say hello to Kubernetes.

Kubernetes
The sales pitch for Kubernetes is:
Containers are a good way to bundle and run your applications. In a production environment, you need to manage the containers that run the applications and ensure that there is no downtime. For example, if a container goes down, another container needs to start. Wouldn’t it be easier if this behavior was handled by a system?
That’s how Kubernetes comes to the rescue! Kubernetes provides you with a framework to run distributed systems resiliently. It takes care of scaling and failover for your application, provides deployment patterns, and more. For example, Kubernetes can easily manage a canary deployment for your system.
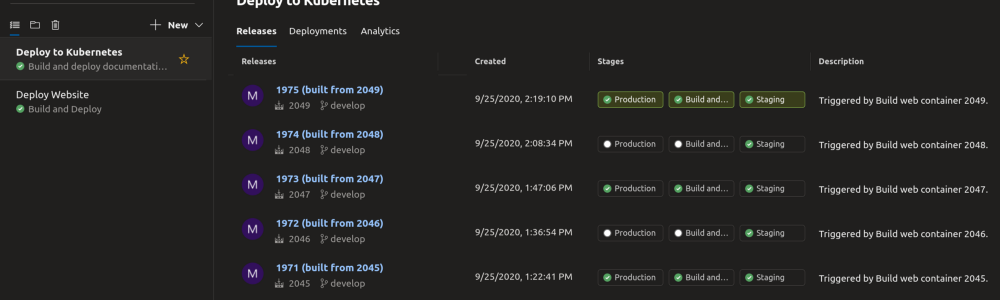
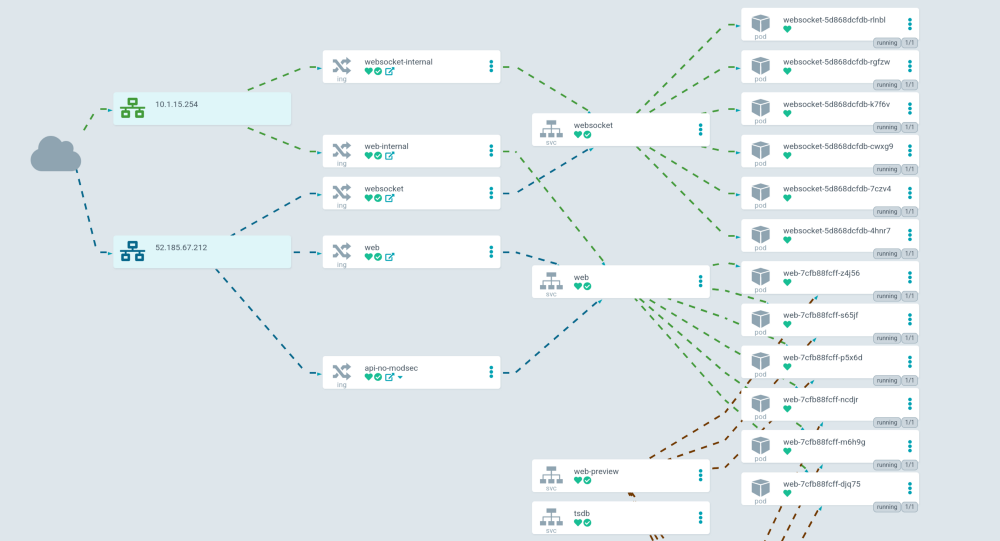
For Sonar, we use Azure Kubernetes Service. The way our continuous delivery works is that we build containers automatically that we can deploy with one click. These are deployed into our Kubernetes cluster.
At a very high level, a Kubernetes cluster is made up of three base components — nodes, pods, and containers. A node is a physical or virtual server that underlies the infrastructure. A pod is a single instance of a particular service (like our web service, API service, or job processor) and containers run on pods. There’s a lot of other moving parts, but that’s the thousand foot view.
We use ArgoCD to deploy changes to our Kubernetes clusters automatically, and to handle deployment, roll back and configuration syncing. Since we use ArgoCD, we can store all of our Kubernetes configurations in a Git repository, and dynamically apply changes to our production environment without any customer impact.
Thanks to the automatic scaling in our Azure Kubernetes Service, we can deploy new nodes in real time as they’re needed. For example, if we get a rush of usage or the application starts consuming more resources, more nodes (virtual machines) will be deployed instantly into the cluster. As usage tapers off, they get shut down. Kubernetes will automatically balance the pods across the new nodes. It’s pretty great.
At the end of the day, what this means is that we have a whole, automated flow to take a developer’s changes through a gauntlet of tests, manual reviews, manual testing, all the way to production. There are no software ‘versions’ or ‘release days’ — we just have features we work on and bugs we fix that get deployed into production as soon as they’re ready. But getting code into production is just a small part of making a modern web application work — we’re just getting started!
Azure Storage
One of the things you can’t live without in a large web application is file storage. We have files that Sonar users upload, invoices that we generate, ACH batches that need to get sent to the bank, logs, migration files from Sonar v1 into Sonar v2, monitoring data that’s delivered from pollers, NetFlow data, and many other needs. When your infrastructure is spread across all kinds of resources that can be temporary, and a user may be served from a selection of data centers, you need a way to deliver those files to that user quickly, and make sure they’re always available.
For this, we rely on Azure Blob Storage today. There’s lots of things we do with Azure Storage as a whole, but blob storage is one of our biggest usages of it.
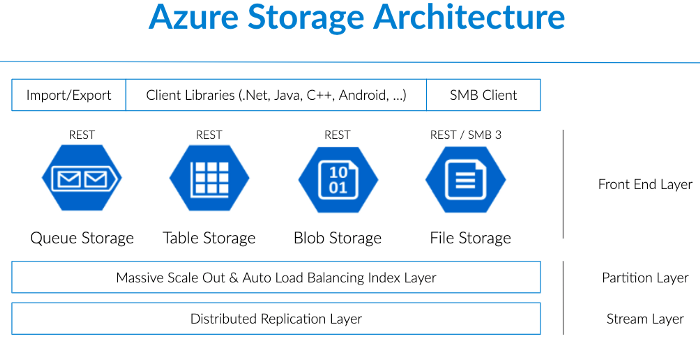
Azure automatically replicates all these files between regions for us for both redundancy and availability, and we essentially have unlimited file storage without needing to manage disks, servers, or storage.
Netflow
An option for tracking data usage within Sonar is using NetFlow. Parsing NetFlow is a pretty intensive endeavor. We receive tens of gigabytes of NetFlow data every second, and every single line has to be parsed and evaluated to see if it relates to a particular customer. To help us manage all this data, we rely on Azure Event Hubs.
We receive the NetFlow data in real time, and ingest each flow into an Azure Event Hub. We then parse all that data and associate each flow with a customer using an IP radix tree, before aggregating it and writing it into TimescaleDB. Just like the rest of the infrastructure, we can easily scale up our NetFlow receivers by increasing the nodes in our Kubernetes cluster, and we can lean on Azure Event Hubs as much as we need. It’s very hard to know at any one time how much data we are going to receive, and not using dynamic, scaling infrastructure here could easily bring our NetFlow parser to its knees.
ElasticSearch and the API
ElasticSearch is an integral part of Sonar. It powers our API and all the wonderful capabilities that exist within it. ElasticSearch is what’s called a document store. It holds structured data in a series of indexes — for example, customer accounts are held in an index called accounts, and IP assignments are held in ip_assignments.
The benefit of ElasticSearch is that it allows for extremely fast searching and aggregation across an index. If we want to search across every field in a typical SQL database, using partial matching, aggregation, and other complex functions, you can quickly end up with a very slow database. SQL databases need proper indexing to allow for fast searching, and it’s not reasonable to just index every single field and have a well performing database and application. This is where we rely on ElasticSearch.
To make this work, the majority of the data that exists in our SQL databases (we use PostgreSQL) has to be synchronized into ElasticSearch in real time. This is no small undertaking, and we run multiple ElasticSearch servers in order to make this happen.
These servers are split into different roles. In an ElasticSearch cluster, there are various tasks each server can perform — the main two being a master node, or a data node. A master node controls the cluster, and a data node ingests documents and provides them back to a requesting user. This provides both scaling, and resiliency, as the documents are replicated across multiple data nodes. If one node drops offline, we can still continue to operate seamlessly from the replicated information.
The main downside of ElasticSearch for our use case is that there is no ability to join data easily like there is in a SQL database. This meant building a very complex, performant, and comprehensive wrapper to expose our ElasticSearch data to our GraphQL API, but that’s a story for another day.
Snowflake and Looker
When we built the latest version of Sonar, we knew comprehensive reporting was going to be a requirement. Our customers hold a lot of data inside our application, and it’s all interconnected in a variety of wonderful and complex ways.
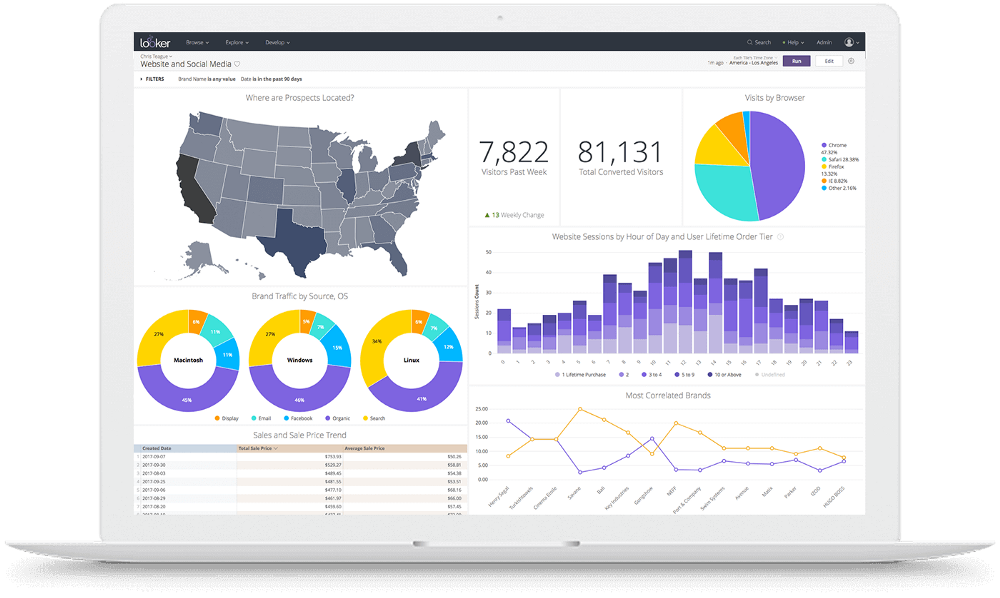
Reporting is a tough problem. The ‘easy path’ is to build custom reports, one at a time, based on need, but that doesn’t scale at all, and is extremely frustrating to both our team and our customers, as they struggle to manage a huge pile of custom reports. We knew we needed something better, and we turned to Looker.
Looker is what’s known as a Business Intelligence system. Wikipedia says Business Intelligence is:
Business intelligence (BI) comprises the strategies and technologies used by enterprises for the data analysis of business information.[1] BI technologies provide historical, current, and predictive views of business operations. Common functions of business intelligence technologies include reporting, online analytical processing, analytics, data mining, process mining, complex event processing, business performance management, benchmarking, text mining, predictive analytics, and prescriptive analytics.
BI technologies can handle large amounts of structured and sometimes unstructured data to help identify, develop, and otherwise create new strategic business opportunities. They aim to allow for the easy interpretation of these big data. Identifying new opportunities and implementing an effective strategy based on insights can provide businesses with a competitive market advantage and long-term stability.
What this means for a Sonar customer is that they can take the data inside Sonar, display it in any way they want, and share it with the rest of their team, quickly and easily. Directly through the Sonar interface, you’re able to build reports and dashboards that present your data in a myriad of displays, and come back to it at any time to see how it’s evolved.
This is a pretty big deal. The business intelligence market is a $20B+ industry — in fact, Google recently acquired Looker for $2.6B. These tools aren’t cheap or easy to implement, but we decided to take on this task for our customers so that they’d have a world class tool for interpreting their data.
If you’ve been paying close attention, you may remember that I mentioned earlier that performing arbitrary searches in a SQL database is not good due to indexing issues. We decided to use ElasticSearch to power our API to solve this problem, but we were once again faced with this issue when deploying Looker. If we wanted our customers to be able to query their data in any fashion they chose, our PostgreSQL database would again be brought to its knees. To solve this, we turned to Snowflake.
Snowflake describes itself as a cloud data platform.
Whether you’re a business or technology professional, get the performance, flexibility, and near-infinite scalability to easily load, integrate, analyze, and securely share your data. Snowflake is a fully-managed service that’s simple to use but can power a near-unlimited number of concurrent workloads. Snowflake is our customers’ solution for data warehousing, data lakes, data engineering, data science, data application development, and for securely sharing and consuming shared data.
What this means for Sonar is that we can replicate data into Snowflake, and use that to drive our Looker reports. We’re now copying data into both ElasticSearch and Snowflake for different use cases, which puts even more load and data transfer requirements on our infrastructure, but it unlocks the power of our customer’s data — inside Looker, you can query on anything and everything to build exactly the reports you need, right from within your Sonar interface.
NodeJS, Swoole, and Redis
I’ve talked a lot about the code deployment process and a lot of the back end infrastructure, but we’re just getting to the actual servers that let you interact with the Sonar application through a browser. To do this, we rely on NodeJS, Swoole, NGINX, and Redis.
The back end of Sonar runs in PHP, using Swoole rather than the typical PHP-FPM executor. Swoole allows us to have a co-routine based, real time PHP application, rather than a typical PHP application that is torn down and booted up on every request. This adds a high level of complexity to the application, but it has allowed us to have unprecedented levels of performance in our API.

We rely on NodeJS for WebSockets, to power all the real time updates in the UI of Sonar, although it’s likely we’ll port this section over to Swoole at some point in the future.
NGINX provides us with our web server, ingress controller, and web application firewall, and Redis allows us to cache data for display in the application, as well as providing a pub/sub system so we can broadcast changes from the server through NodeJS to a client. NodeJS, Swoole, and NGINX are all run independently inside our Kubernetes cluster. Redis runs on dedicated virtual machines.
Redundancy
So now, let’s talk about redundancy! What do we do if something fails?
Firstly, all of our services that run on dedicated virtual machines have multiple instances deployed that we can fail over to. PostgreSQL replicates in real time to backup servers, as well as streaming all data to offsite storage in real time. TimescaleDB functions in exactly the same way as PostgreSQL. Our ElasticSearch deployment has multiple master and data nodes, so that we can lose multiple servers without any impact. Redis runs alongside Redis Sentinel. All of these services are running on separate virtual machines, in separate data centers, spread through the Azure cloud.
While this redundancy makes Sonar very resilient, it adds a lot of additional complexity. On top of the configuration management and monitoring needed to enable this redundancy in all these applications, we now have to deal with network issues between Azure data centers, packet loss, and latency — we watch hundreds of metrics on every application to make sure they’re operating properly.
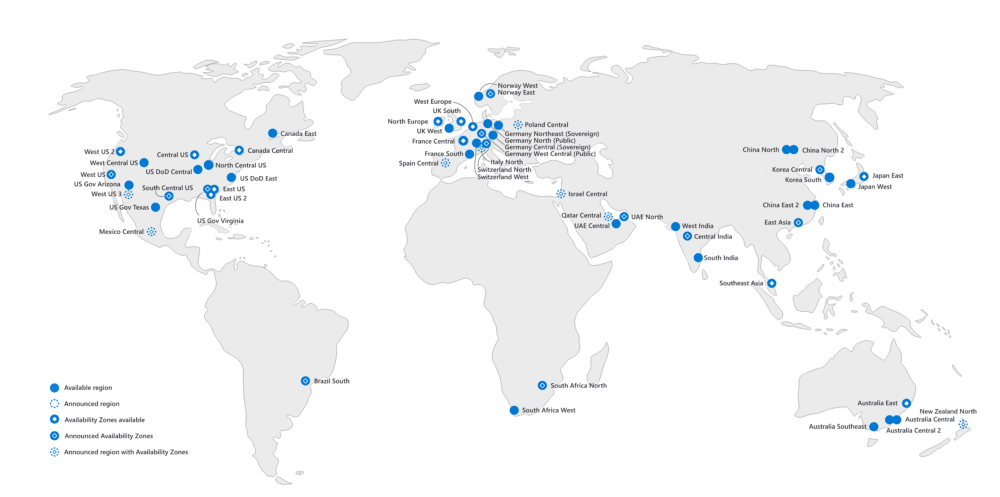
Azure also offers Availability Zones for their Kubernetes product, which we take advantage of. For example, in our Central US region, there are three availability zones, which we use all three of. This means for any node pool we have running in Kubernetes, we must have a bare minimum of three nodes to maintain resiliency, and we have to monitor all of them in real time, as well as taking into account any impact latency has on the application.
All customer data is flowing around and being replicated to multiple places constantly, and we have to monitor this replication for errors, as well as test our backups to ensure they are functioning. Dealing with the configuration and monitoring of this system, as well as reacting to any issues, is a full time job in and of itself.
Monitoring
We have to watch our infrastructure constantly. Issues can creep up very quickly, and a failure in one part of the system can quickly cascade to the rest. There are many, many facets to monitoring an application like this, and we have to observe each of them intently to avoid customer impacting events.
For the vast majority of our monitoring, we rely on DataDog. DataDog offers an agent that can be used on virtual machines and inside Kubernetes to monitor an incredible number of metrics. Back in the ‘old days’, monitoring CPU usage, memory consumption, and available disk space was typically enough to make sure your servers were running appropriately. Now, the world has changed.
Application Performance Monitoring
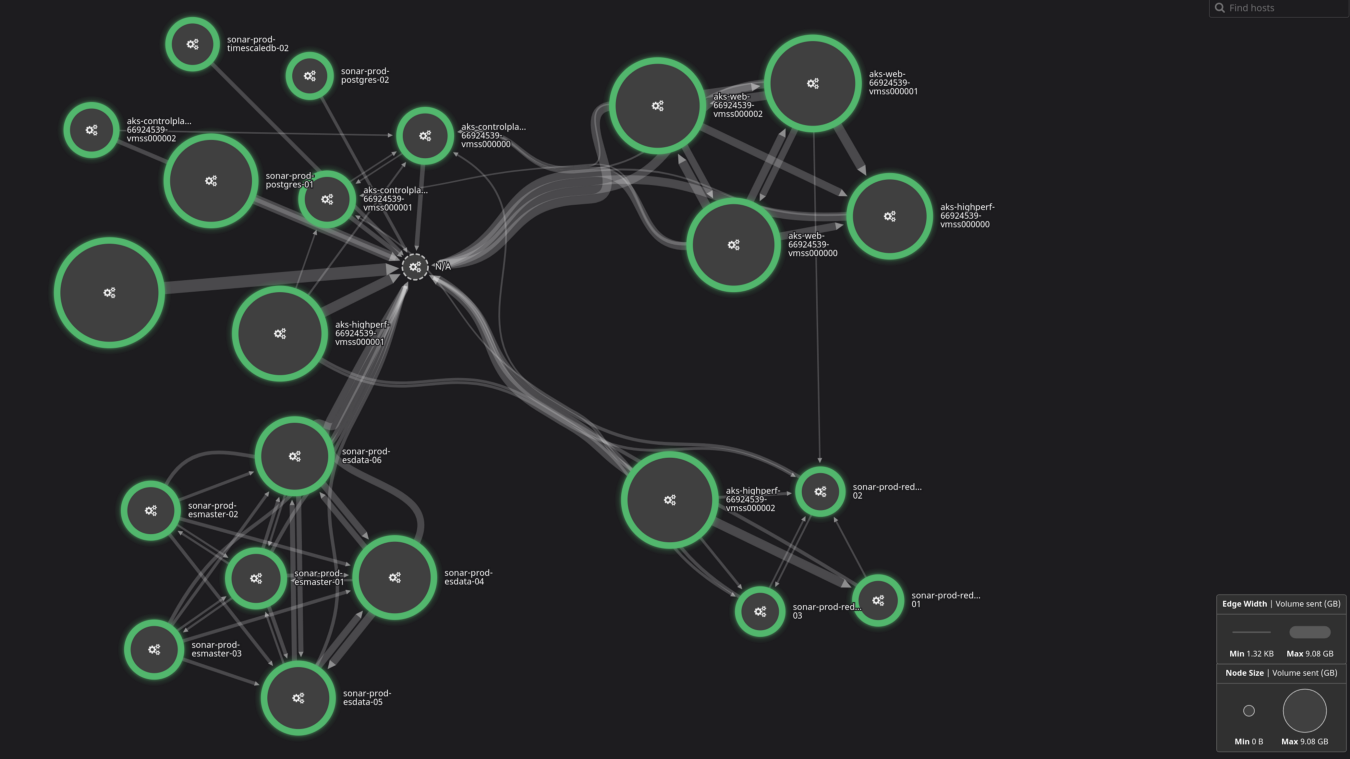
One of the first things we look at for issues is our application performance monitoring system. This system allows us to watch every single request made in the system, and follow its path throughout the entire application. A request to the API traverses our Kubernetes cluster, through our ingress controller and web application firewall, to Swoole, to ElasticSearch, and back. If any jobs need to be fired, data is pushed into Redis, and picked up by our job workers. Changes are replicated into Snowflake, written to PostgreSQL, and more. Every tiny request touches many systems, and so it’s critical we can see how it’s working.
This is an animation of our application performance monitoring in real time. We can literally see everything that’s happening inside the application, as it happens, and get alerted of anything that’s outside normal service. If something doesn’t look right, we can dive into that request and see everything it touches.
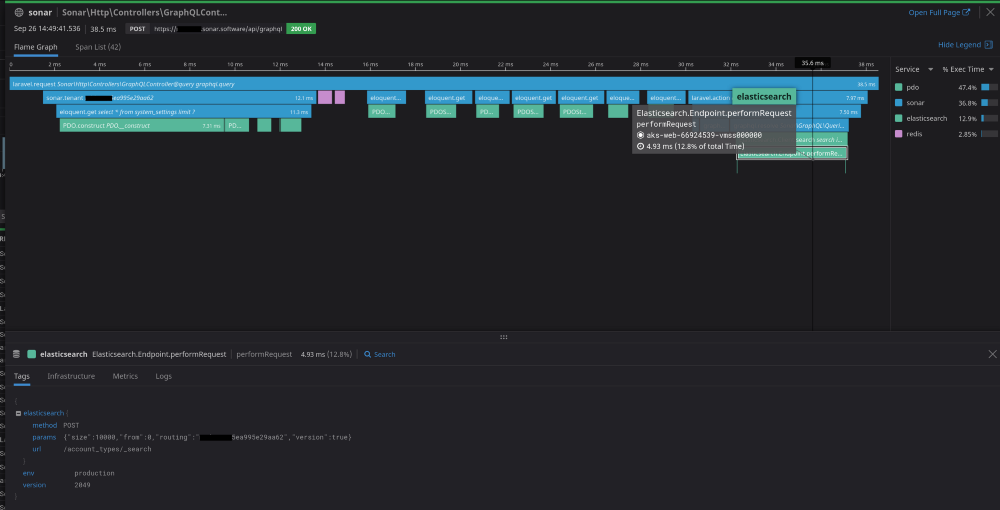
We’re constantly watching this to make sure things are operating well, and it’s a great tool to also evaluate the impact of any changes we make.
Logs
Everything we use generates copious logs, and we aggregate them all into DataDog so that we can parse and evaluate them. We can analyze these logs, look for anomalies, and react to issues as they begin to appear, not once they’ve already affected service.
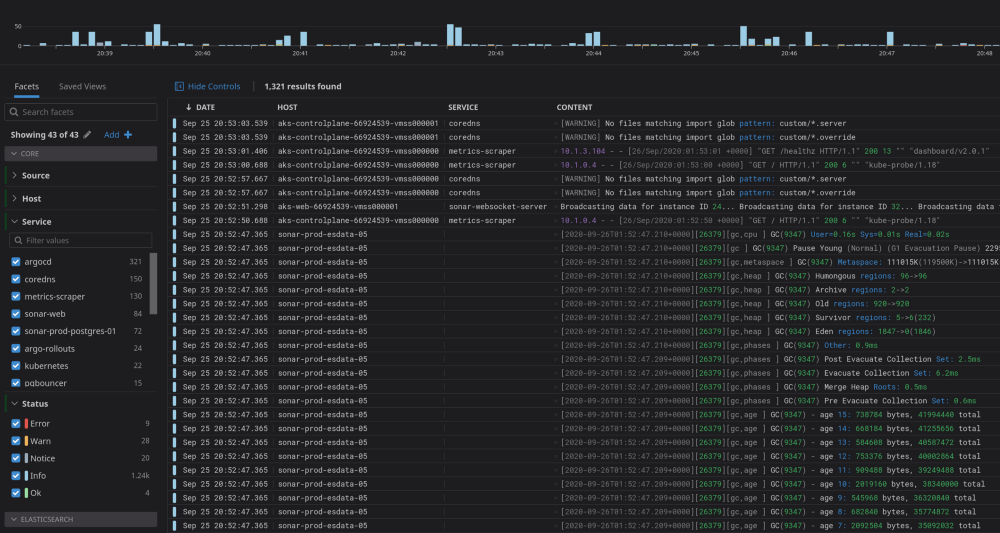
There’s a huge volume of data generated, and we already try to filter them down to only the important items. This month so far, we’ve indexed 8.46 million logs into DataDog, and there’s no way to find needles in a haystack that size — we have to rely on many monitors and anomaly detectors to alert us to problems.

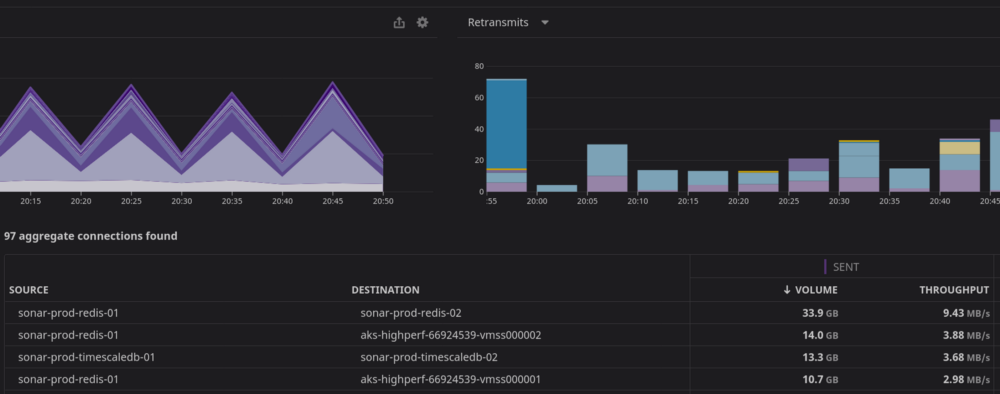
Next, we have to monitor the network. Even though we rely on the network provided by Azure, things don’t always go according to plan, and we have to be ready to react to any issues. DataDog provides us with some phenomenal tools to keep an eye on things, both historically and in real time.
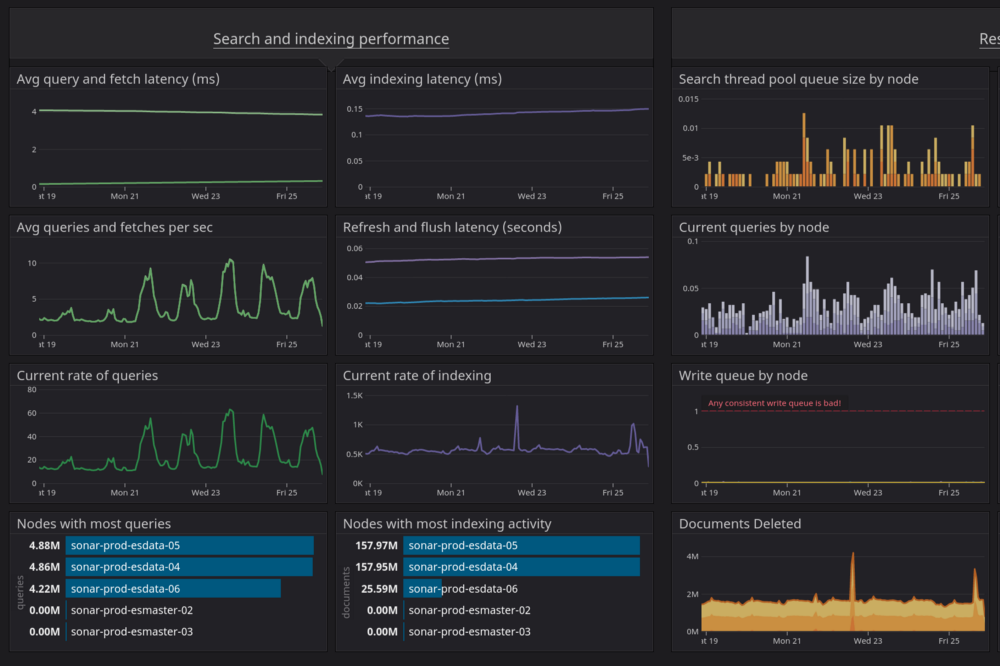
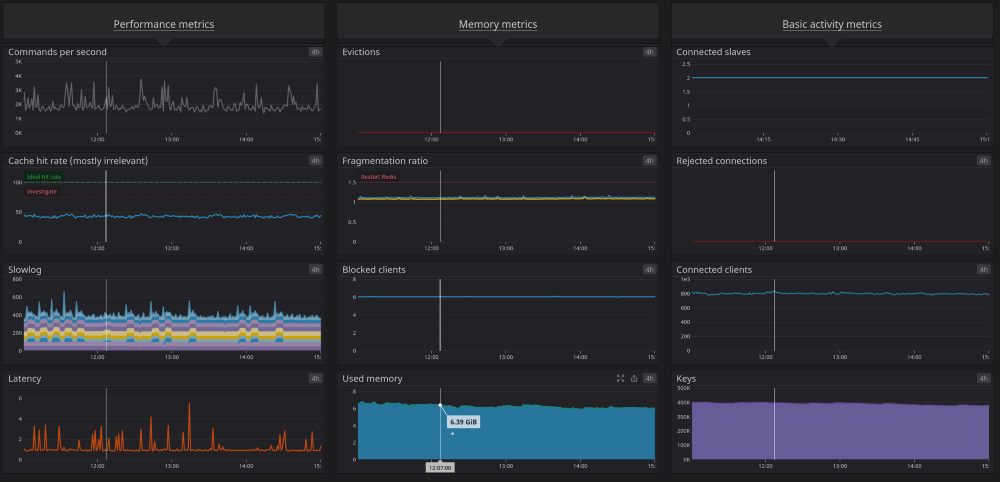
Finally, there’s all the ‘normal stuff’. Do we have enough CPU capacity? Are any nodes running low on memory? Every application has metrics that need to be measured — are the ElasticSearch queues filling up? Is PostgreSQL nearing a transaction ID wrap? There are hundreds and hundreds of metrics like these that we have to watch constantly, and we have monitors and dashboards setup in DataDog to view and alert us on any issues that are found.
And more…
Finally, this is just a snapshot of some of the things we handle for you as of the time of writing. This is constantly in a state of evolution — we’re always evaluating new systems, making changes, deploying new technologies, and testing out new options. In the last year alone, we’ve switched to using Swoole, implemented Looker and Snowflake, added DataDog APM, and that’s just the things I can think of off the top of my head. Things are always changing, and we’re always changing along with it, and we do all of this for you as part of the service we offer.
I started this article with “Long gone are the days of applications of any significant size running on a simple single server, with a web server, a small database, and a single language powering it” — hopefully this has helped you understand what I meant! Feel free to reach out with any questions — I always enjoy talking about technology.