A network site is a location on your network that contains some kind of service providing hardware. For many ISPs, these locations are referred to as a POP or a hub. In a wireless ISP, this may be a tower site or another outdoor location that wireless/LTE access points are installed at. A network site could also be a data center or other central/edge location.
Network Sites in Sonar allow you to monitor the tower hardware, customer hardware, and customer connections connected to the network and can be used as a means to measure the overall health of your network. Once configured, Network Sites will form a critical part of your early warning system for network quality issues.
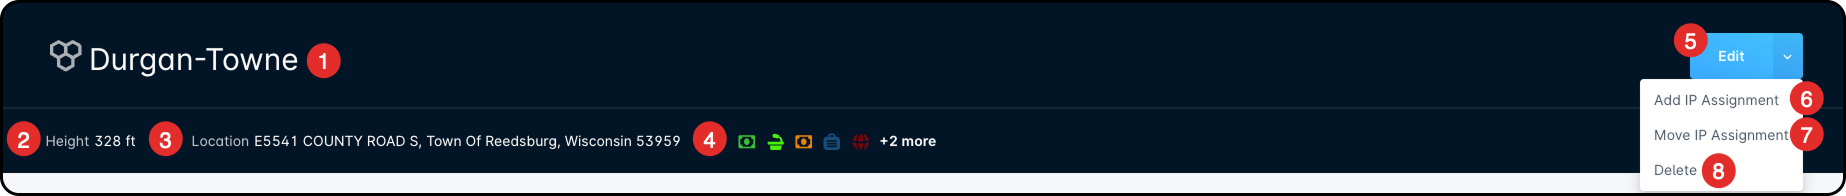
Entity Icon & Network Site name: This displays the Entity Icon, which in the case of a Network Site will always be the same, along with the name given to the Network Site upon creation.
Height: The height of the network site, measured in feet from the ground level of the area.
Location: The serviceable address associated with the Network Site is listed here.
Custom Links: This displays the custom link icons associated with the Network site. Clicking on a Custom Link icon will automatically open a new browser tab and take you directly to where you want to go.
For more information on Custom Links, refer to this article.
Edit Menu: Clicking the Edit button allows you to modify the Network Site's information, including name, height, and serviceable address.
Add IP Assignment: Expanding the Edit menu allows you to access additional functions, such as quickly adding an IP assignment to the Network Site.
Move IP Assignment: Expanding the Edit menu allows you to access additional functions, such as moving an IP assignment from one Network Site to another.
Delete: As above, expanding the Edit menu allows you to delete the Network Site entirely, removing all assigned devices and IP assignments.
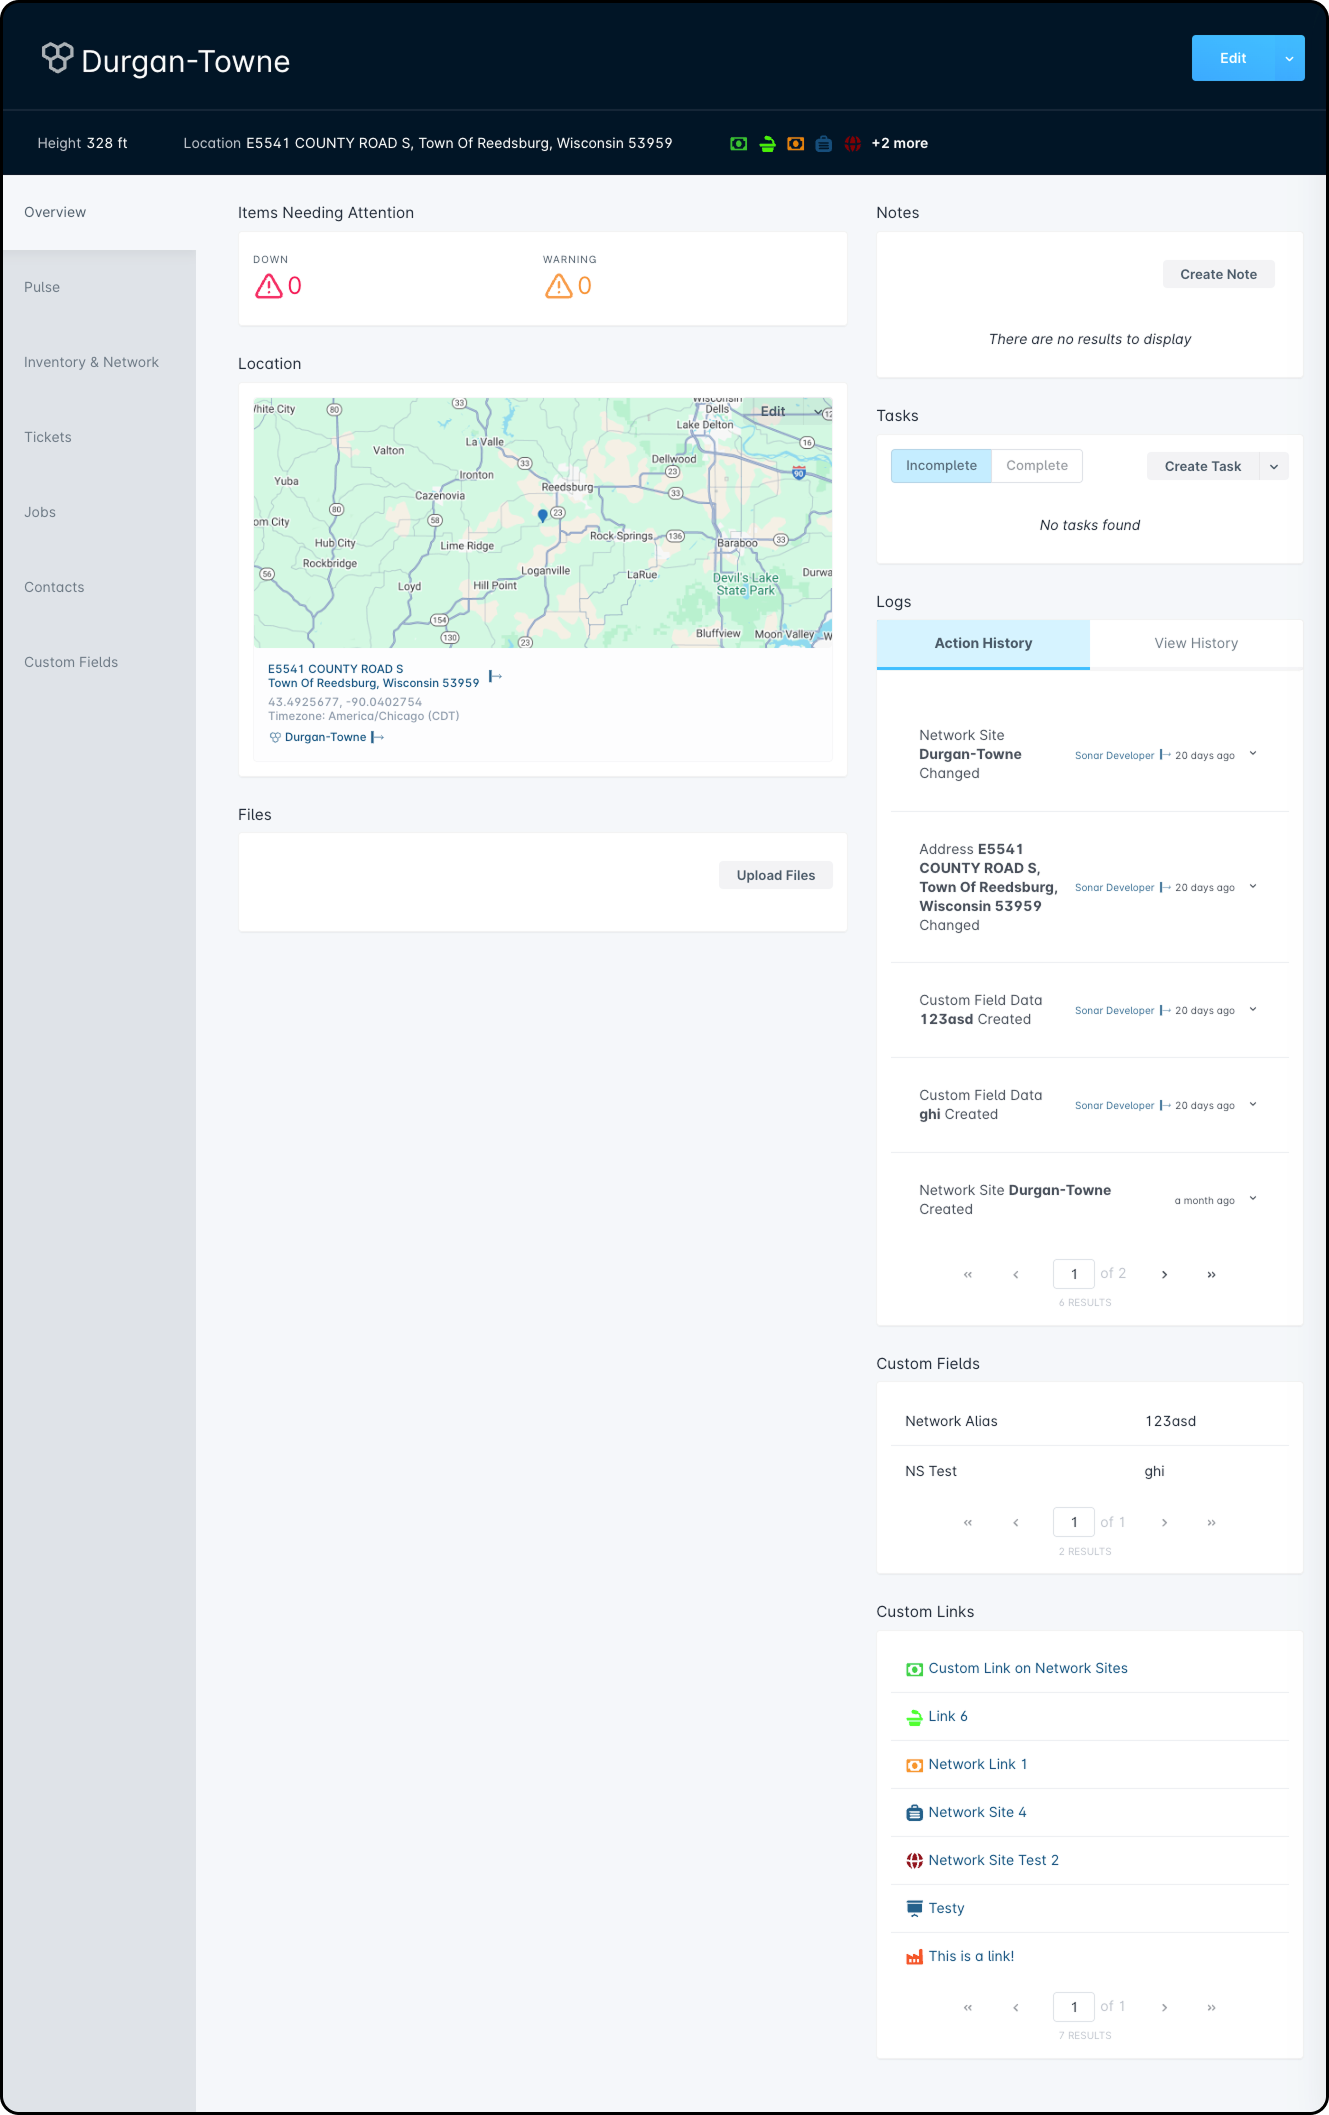
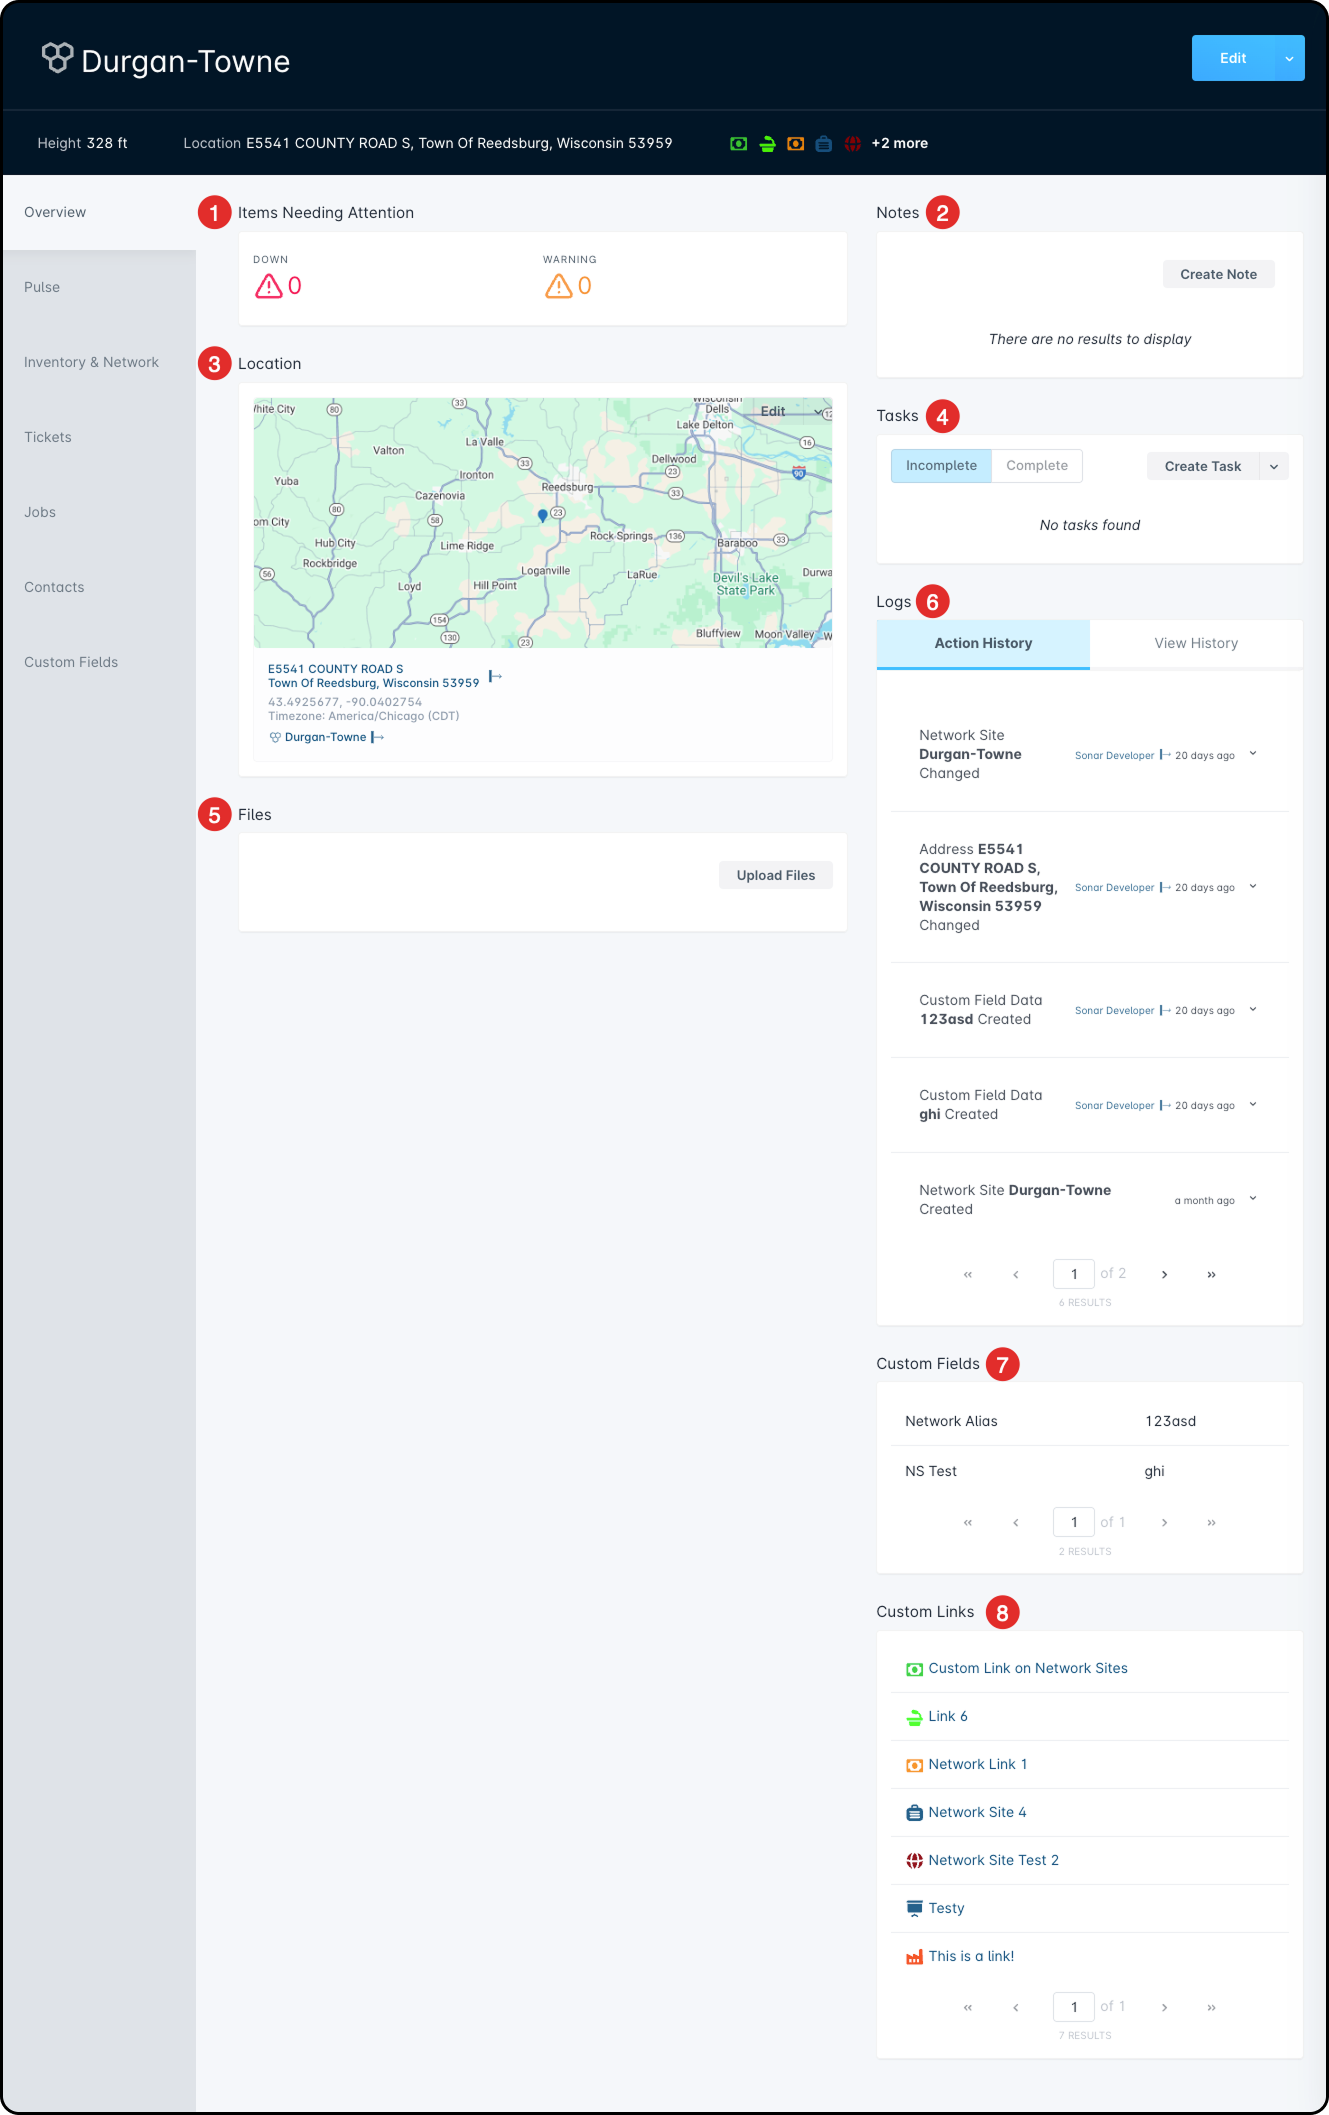
The Overview tab
The Overview is designed to provide a similar quick glance into your Network Site as the Landing page, while still providing a few additional details, such as the Notes, Files, Logs, and Custom Fields. This tab is what appears by default as soon as you access the management interface for a Network Site.
Items Needing Attention: This modal displays the devices connected to this network site that – through configured monitoring templates – are found to have connectivity issues, resulting in either a “Warning” state (frequent disconnections, loss of speed, or flapping connectivity) or a “Down” state (no connectivity at all/unreachable device).
Notes: Any notes created on this Network Site will be displayed here and this is also where you can edit/delete them, or create a new one.
For more information on Notes, refer to this article.
Location: This modal shows the Network Site's Physical location on a map, and lists the physical address below the map.
Tasks: This is where you can create new tasks for the Network Site, view existing tasks, and assign them to specific users within Sonar. Toggling between the “Incomplete” and “Complete” buttons will display tasks that have not yet been tackled, as well as ones that have been taken care of already.
For more information on tasks, refer to this article.
Files: This is where you can store and review any files that are relevant to the Network Site, and any file format is accepted. Once you upload a file, it will appear as a tile within the Files area – if it is an image, a sliver of it will appear within the tile; otherwise, if it is a different type of document it will remain gray. Clicking this section will cause the sidebar menu to appear, which will contain further details about that particular file. This includes the file name, size, type, the user who uploaded it, a preview if the file type is an image, details about the Network Site that this file is attached to, an activity log for any actions taken on the file, and also a “Download” button which will download the file to your device. Within the tile there is also a vertical 3 dot menu – clicking this will provide you with the options to edit the file or delete it entirely.
Files that can be uploaded to a Network Site must not exceed 100 MB.
Logs: All activity on the Network Site is recorded here in the form of logs. The action that occurred will be displayed, along with the icon of the user that performed the action and how long ago the action took place. Clicking on a specific log entry will display further details about that particular action.
Custom Fields: Any custom fields that are set up for this Network Site will be displayed here, as well as under the “Custom Fields” tab on the left panel. These are strictly here for display purposes – to edit the custom fields, you can click the “Edit” option within the Network Site header, near the top of the page.
To learn more about custom fields, refer to this article.
Custom Links: Any Custom Links associated with the Network Site will be displayed here. Clicking on a Custom Link will automatically open a new browser tab and take you directly to where you want to go. This section will show a maximum of 10 Custom Links per result page.
For more information on Custom Links, refer to this article.
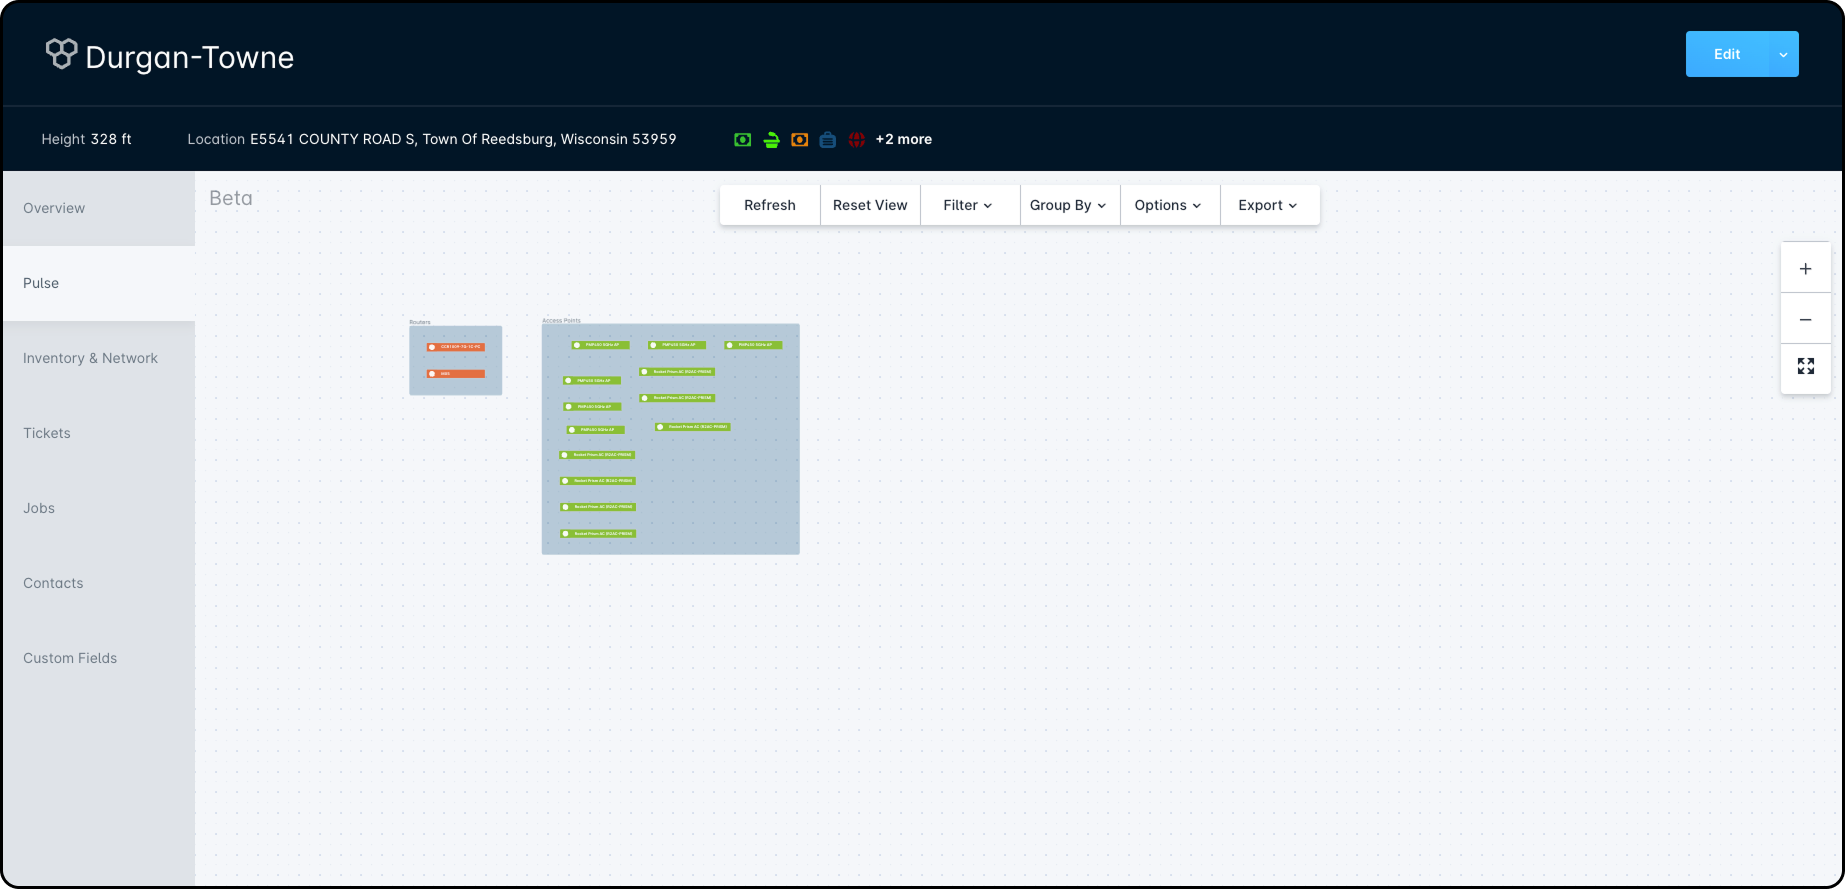
The Pulse Tab
The Pulse tab in Sonar is an automatically generated network map for your instance, specific to the individual Network Site. Pulse will dynamically display and arrange connected devices, interfaces, and other equipment assigned to the Network Site.
The generated Pule map is based on two things:
Inventory Assigned to the Network Site.
IP Addresses assigned to and from the Network Site.
Due to the complexity of Pulse in Sonar, an article with more information is recommended reading if you have additional questions | Pulse Behavior & Best Practices
The Inventory & Network tab
The Inventory and Network tab is where you'll find information on the IP Addresses and hardware assigned to your Network site.
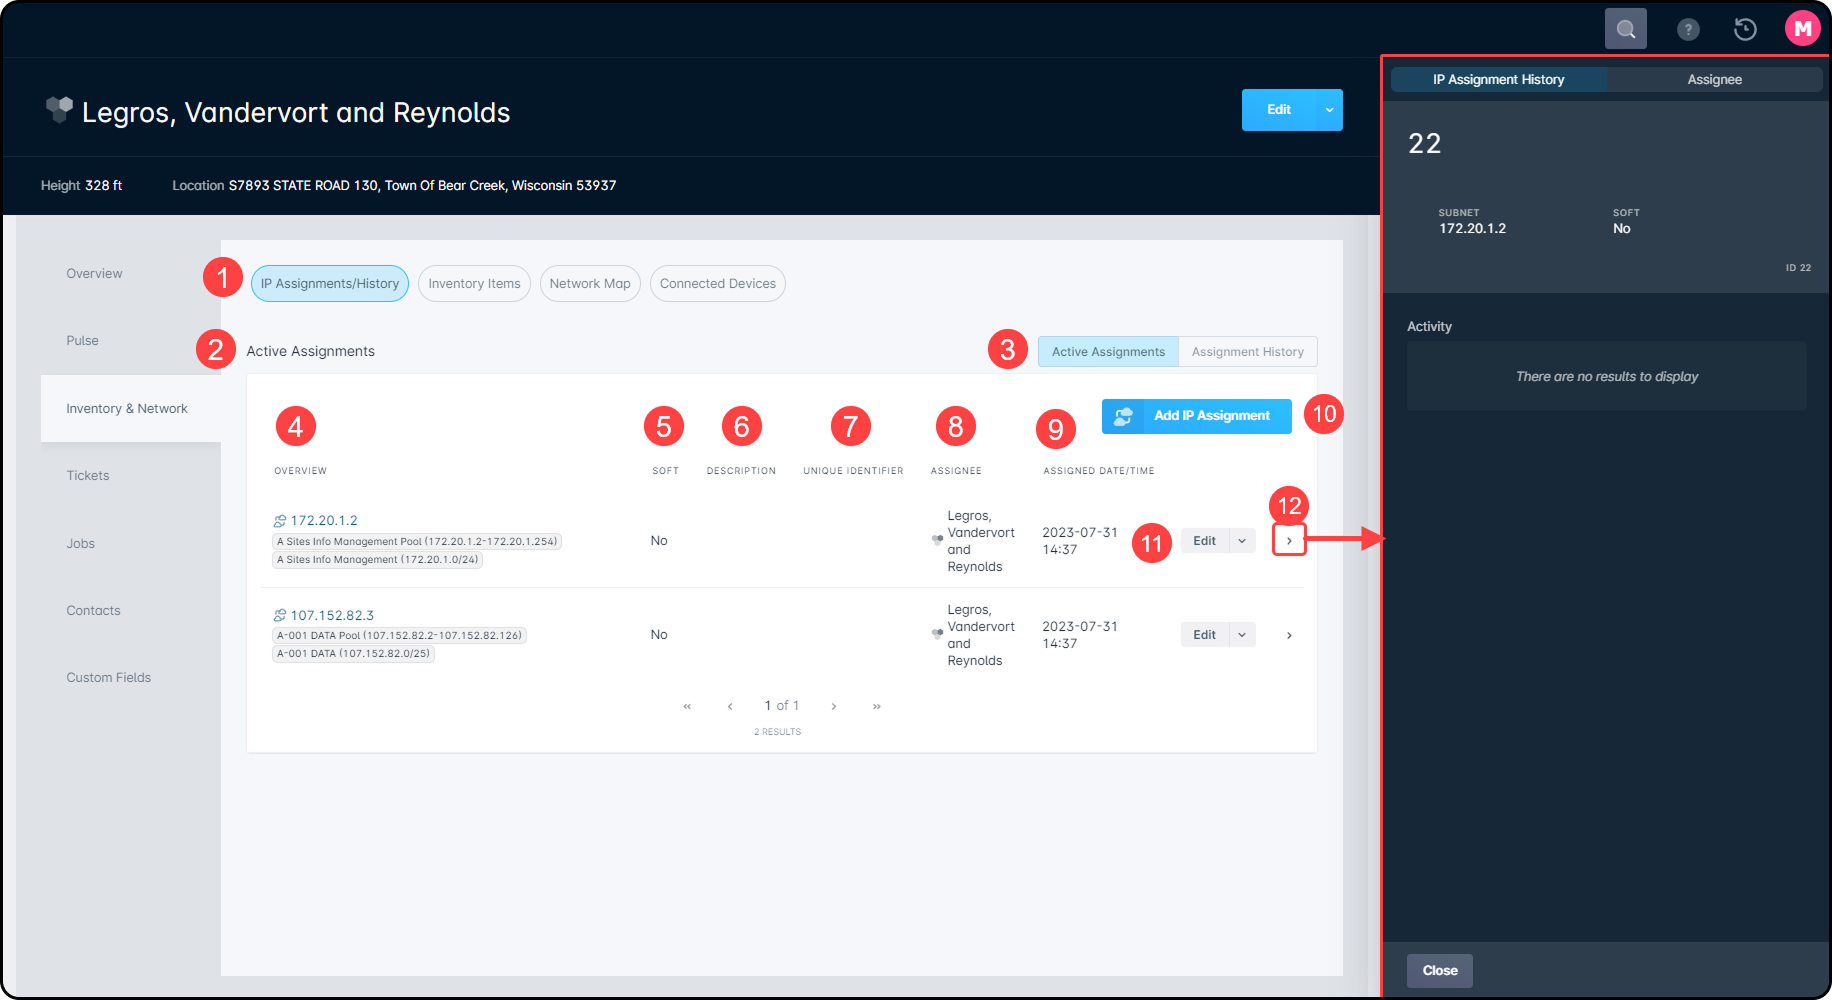
IP Assignments section
IP Assignments/History & Inventory Items toggle: These two buttons allow you to toggle the view between the IP Assignments view and the Inventory Items view (explored further below).
The Active Assignments table: By default, upon accessing the Inventory & Network tab, you'll be sent to this table view, showing all current IP Assignments on the Network Sites.
Active Assignments/Assignment History toggle: This toggle allows you to switch the current view between the Active Assignments view and the Historical Assignments view.
The Overview column: The overview column lists the IP Address, its supernet, and its subnet. Clicking on the IP address will redirect you to the IP address management page.
The Soft column: The Soft column shows whether the IP Address in the corresponding position on the overview column was soft assigned.
Description: The description column will display any description which was added during the assignment of the IP Address.
Unique Identifier: This column will identify the device by the field identifier against which the IP address is assigned.
Assignee: The Assignee column lists the device to which the IP Address is assigned.
Assigned Date/Time: This column will provide the date and time that the IP Address is assigned.
Add IP Assignment: The Add IP Assignment button lets you add a new IP Assignment directly from the Network Sites tab, instead of needing to go through the IPAM interface.
Edit: The Edit section allows you to edit an existing IP Assignment or delete the assignment entirely.
IP AddressItem Sidebar: clicking the arrow of a line item here will populate a sidebar, providing you quick information on details such as IP assignment history, assignee, etc.
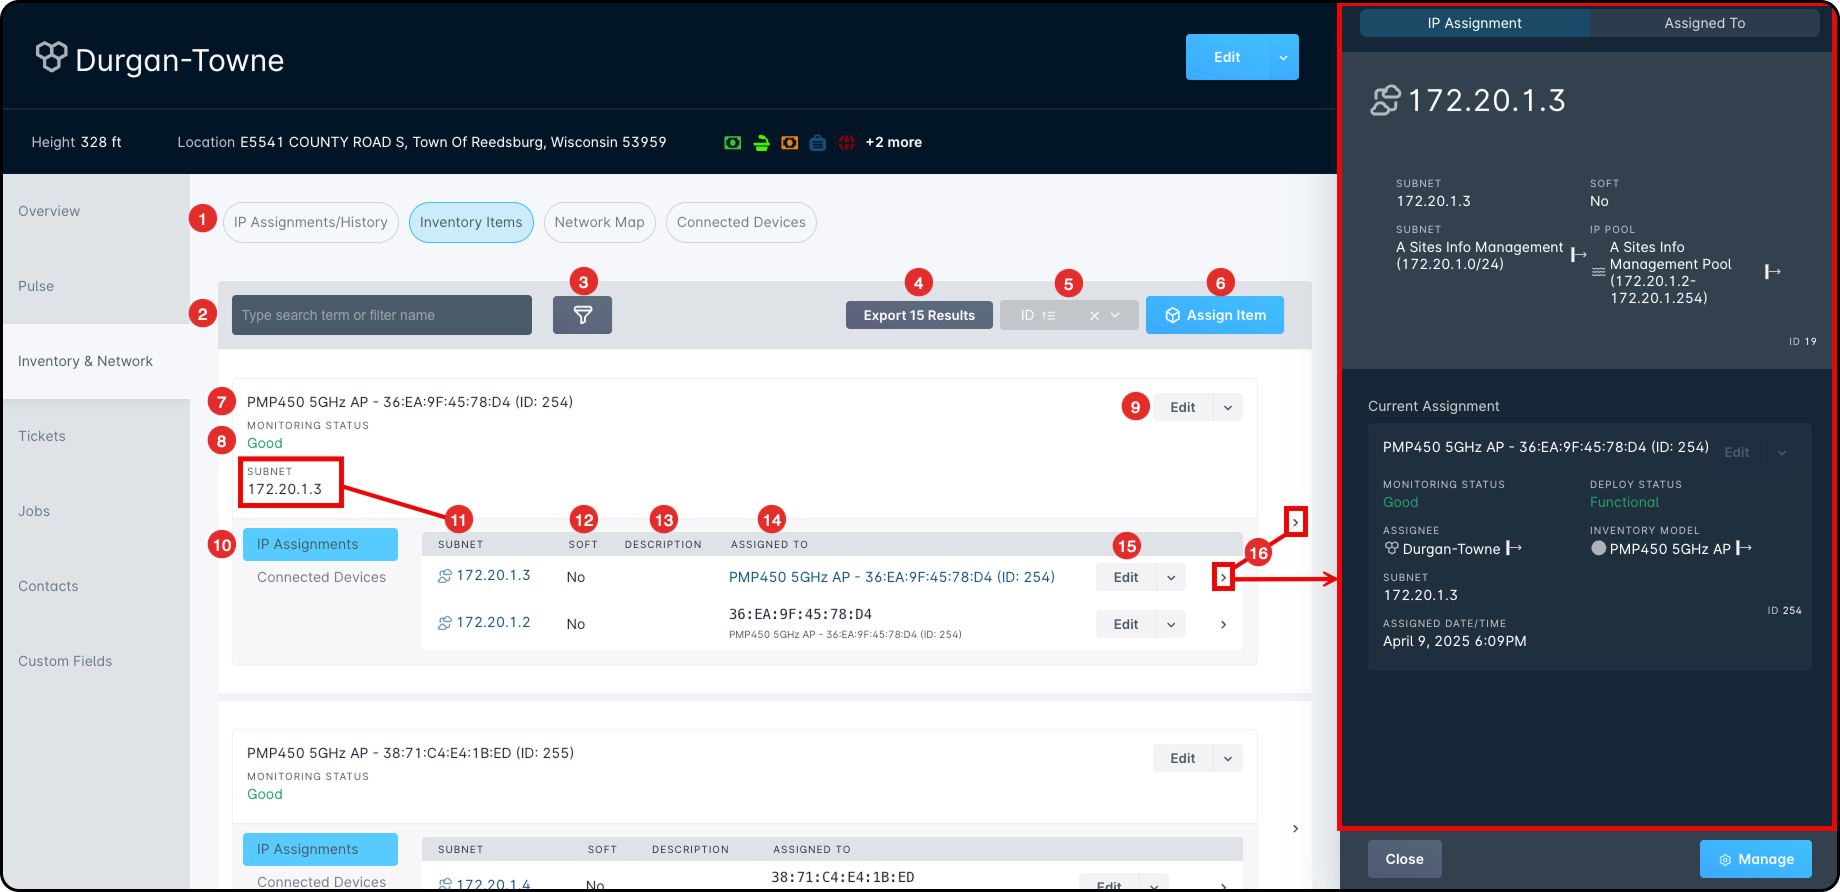
Inventory Items section
IP Assignments/History & Inventory Items toggle: This section denotes which side of the Inventory and Network tab you're on. Currently, this is the Inventory Items page.
The Search field allows you to search for a device or IP address by typing in its information.
The Filterbutton will open the Filter editor, which allows you to choose a preset filter and then narrow down the subset items.
For more information on Filtering, refer to this article.
Export [X] Results: This button allows you to export a list of Inventory Devices on this Network Site out of Sonar as a JSON or CSV formatted file.
Sort order: This button allows you to alter the order by which the inventory devices on the Network Site are sorted.
Assign Item: This button allows you to assign an inventory item to the Network site that currently exists in an inventory location, on a generic inventory assignee, assigned to an individual, or assigned to a vehicle.
The device model, MAC Address, and ID are displayed on this row, allowing for easy identification of the assigned item. Clicking on the Model name will open the device's management page. Clicking on the device model name will take you directly to the device management page.
The Device Status row displays the “health” of the device and is a reflection of the measured statistics captured by your monitoring device. The Device Status Message displays the cause of the Device Status when in a troubled state, such as Warning or Down.
The dropdown alongside the Inventory Item Edit button allows you to:
Edit Field Values
Change Assignee
Add IP Assignment
Link Ticket
Create SNMP Override
Delete the Inventory item entirely
Whereas, clicking on Edit will open the following modal:From this modal, you're able to set the inventory to the network site coordinates or input custom coordinates. These settings dictate where the equipment is visible on the network map page, which we'll touch on later. For Fiber networks, this can be particularly beneficial to easily identify where items such as demarcation boxes are installed within the field.
If inventory is moved from one network site to another, it'll automatically move to the new location on the network map. However, the visible coordinates will need to be manually set again.
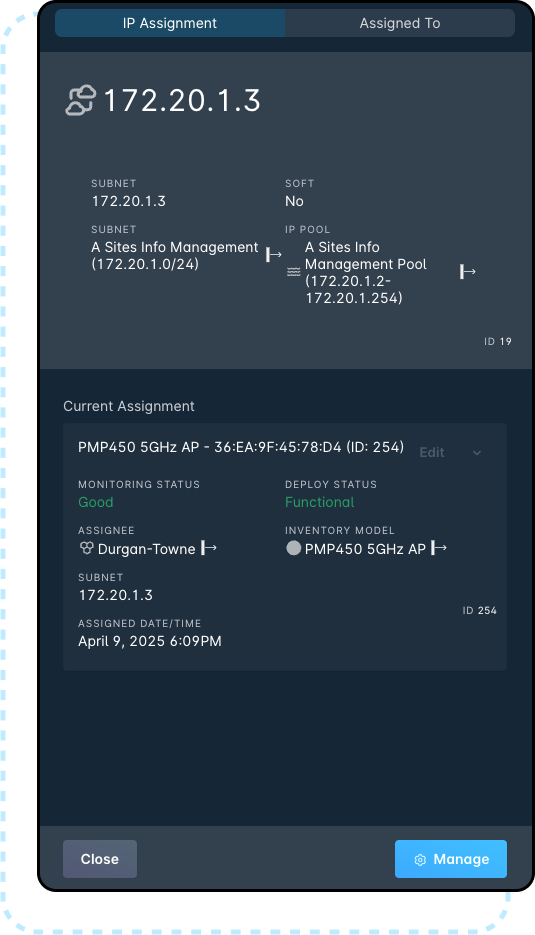
IP Assignments/Connected Devices toggle: This selection will display all assigned IP addresses on the targeted inventory item, and allows you to toggle the view to see devices connected to the inventory item being targeted.
Subnet: Displays the assigned IPv4 Address or IPv6 subnet.
Soft: This column will display whether or not the IP Address was soft assigned in Sonar.
Description: This column will reflect the description provided to the IP Address or subnet when the assignment was made.
Assigned to: The Assigned To column will reflect which device has the IP Address assigned. Clicking on the device name from this column will also open the device sidebar.
The IP Assignment Edit button allows you to modify or delete the IP assignment
Device/IP Address Management sidebar: This sidebar allows you to monitor the device statistics, such as SNMP or ICMP stats, and by clicking on the Manage button you can access the device's management page or see the IP Address Management page.
Network Map
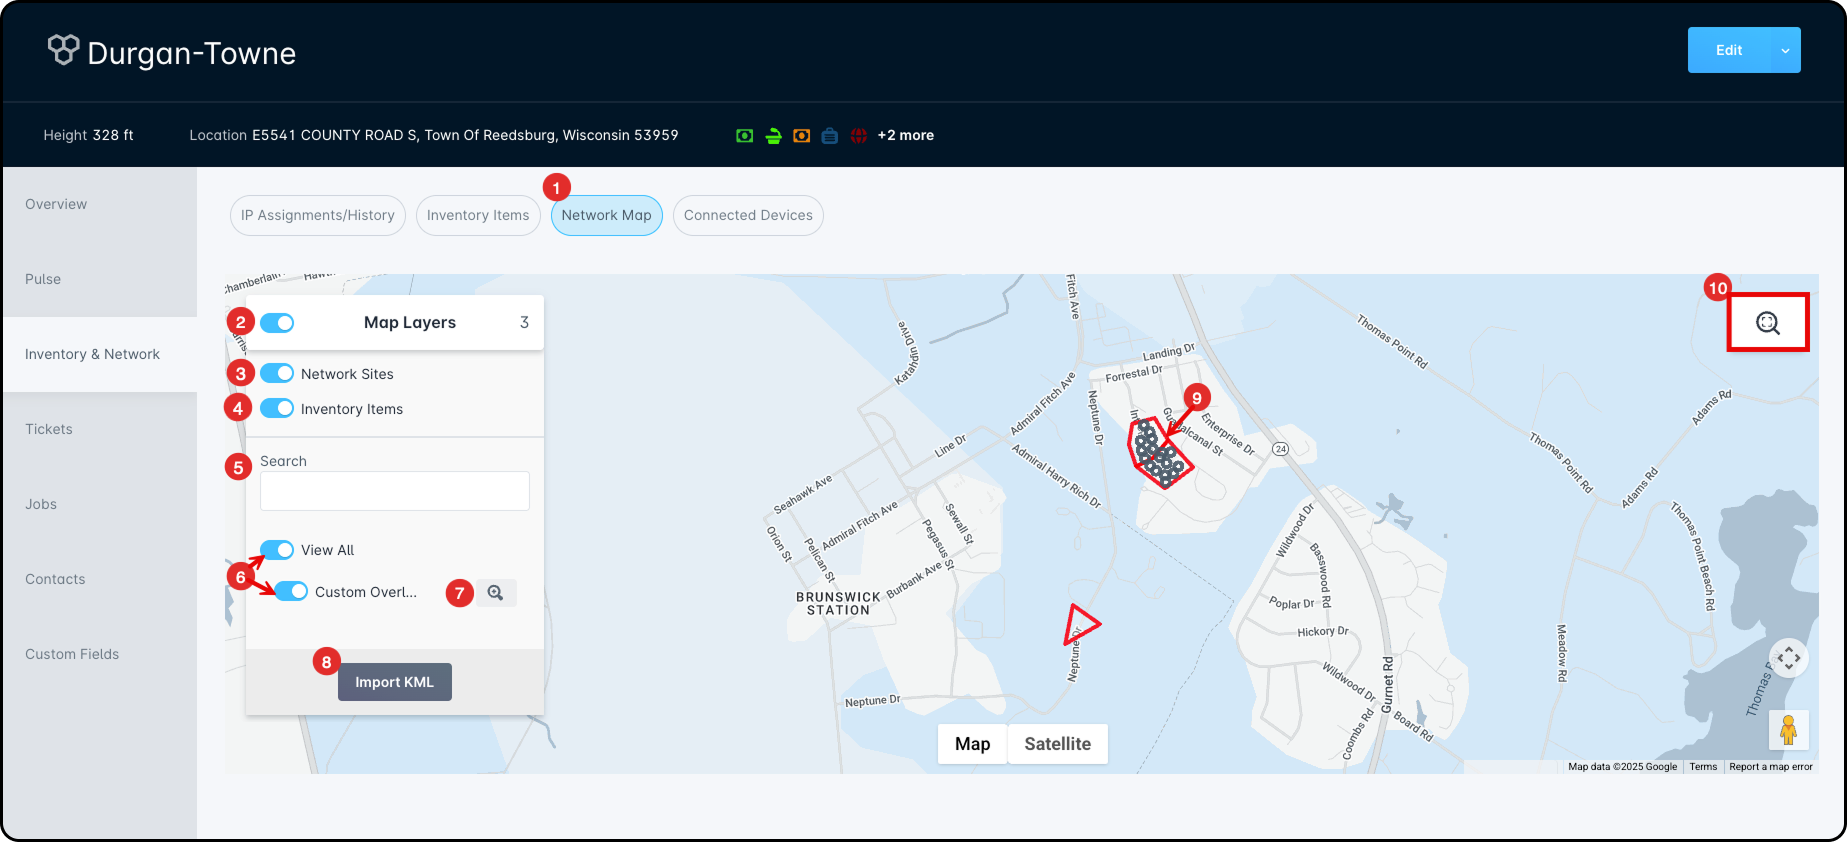
Network Map tab: This section denotes which side of the Inventory and Network tab you're on. Currently, this is the Network Map page.
Map Layers toggle: This controls all the toggles below, allowing you to easily turn map layers on or off.
Network Sites toggle: This toggle allows you to view network sites in the area.
Inventory Items toggle: This allows you to view any inventory items associated with the network site you're currently viewing.
Search function: In the event that you have numerous custom overlays, the search feature allows you to locate a specific overlay and toggle it on or off.
View All toggle: This toggle acts as the parent of all custom overlay toggles, providing the ability to easily turn them all on or off. Any associated custom overlays will be listed below, with individual toggles that can also be utilized.
Zoom icon: Alongside any custom overlays is the option to zoom in to take a closer look at the overlay on the map.
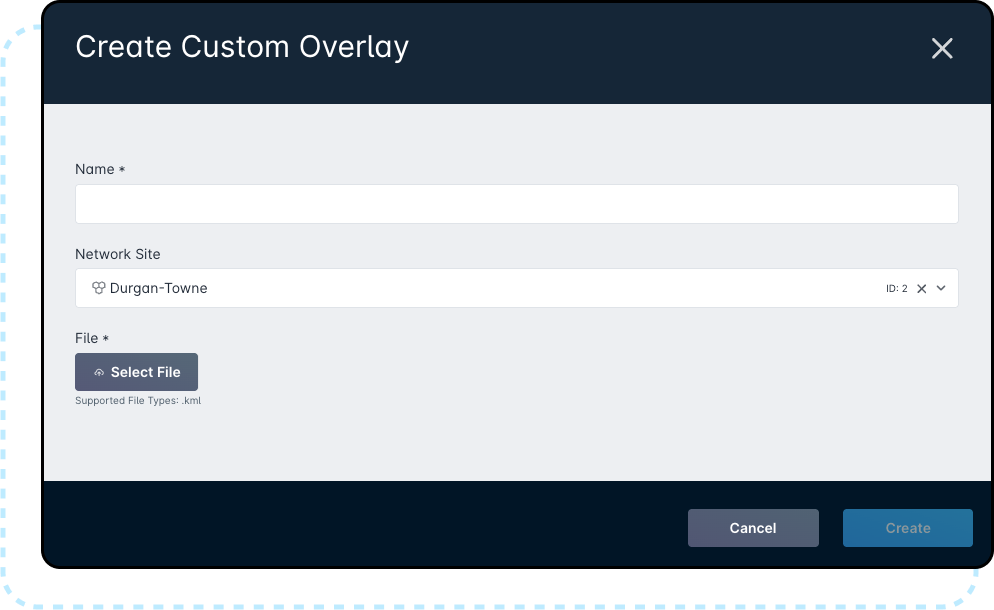
Import KML button: Clicking this will prompt a new modal that allows you to import a KML and associate it with any existing network site in your instance. By default, the network site you are currently on will populate underneath the “Network Site” header.
The maximum file size you can upload is 10 MB.
Only .kml file types can be uploaded to your instance. If you have an alternate GIS file type that you wish to use, you must convert it to .kml first.
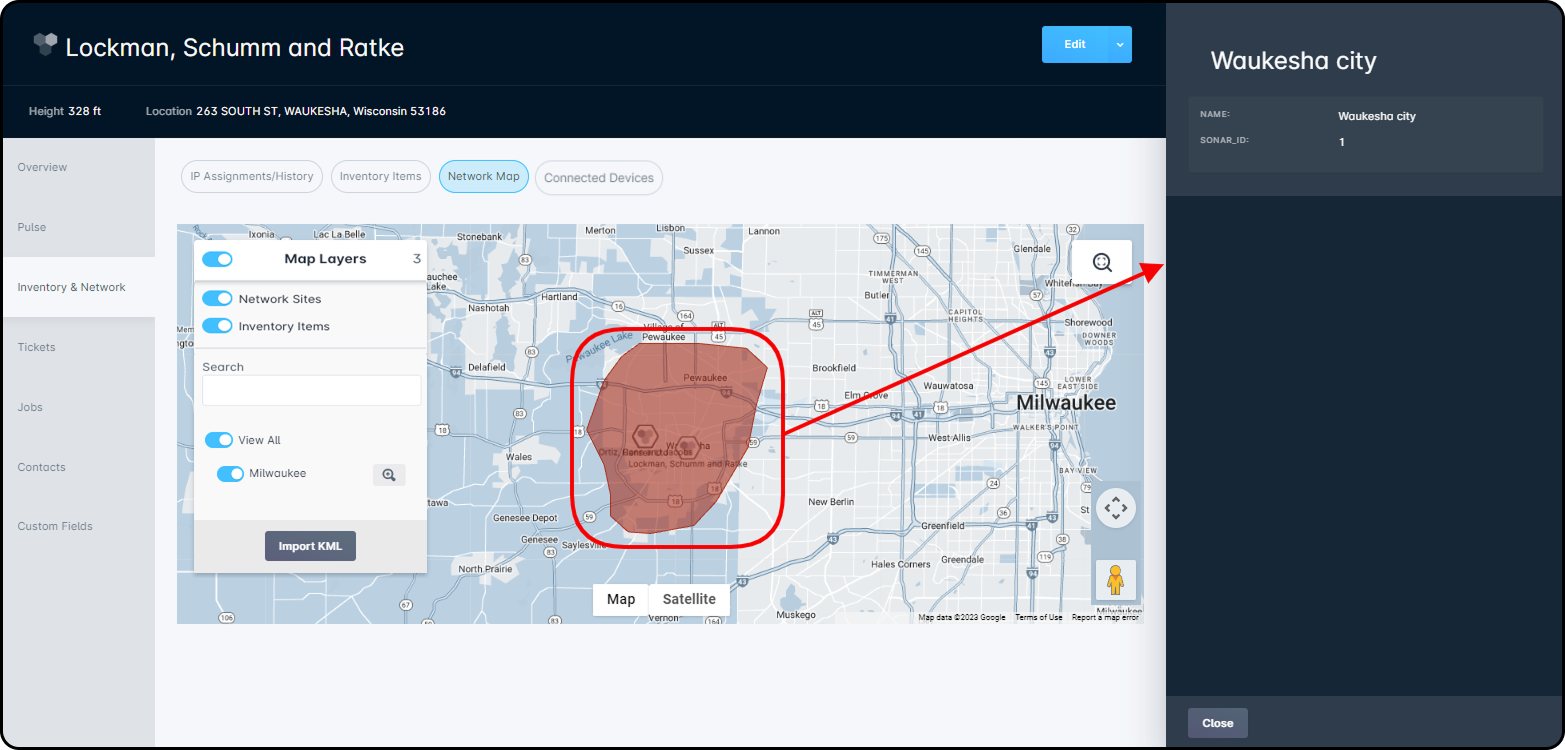
Clicking on a custom overlay directly from the map will open a sidebar menu that includes any details from the KML file.
The reset map tool allows you to be immediately brought back to the original boundaries associated with the network site; this can be particularly helpful if you've zoomed in or out, or moved across the map and away from the site.
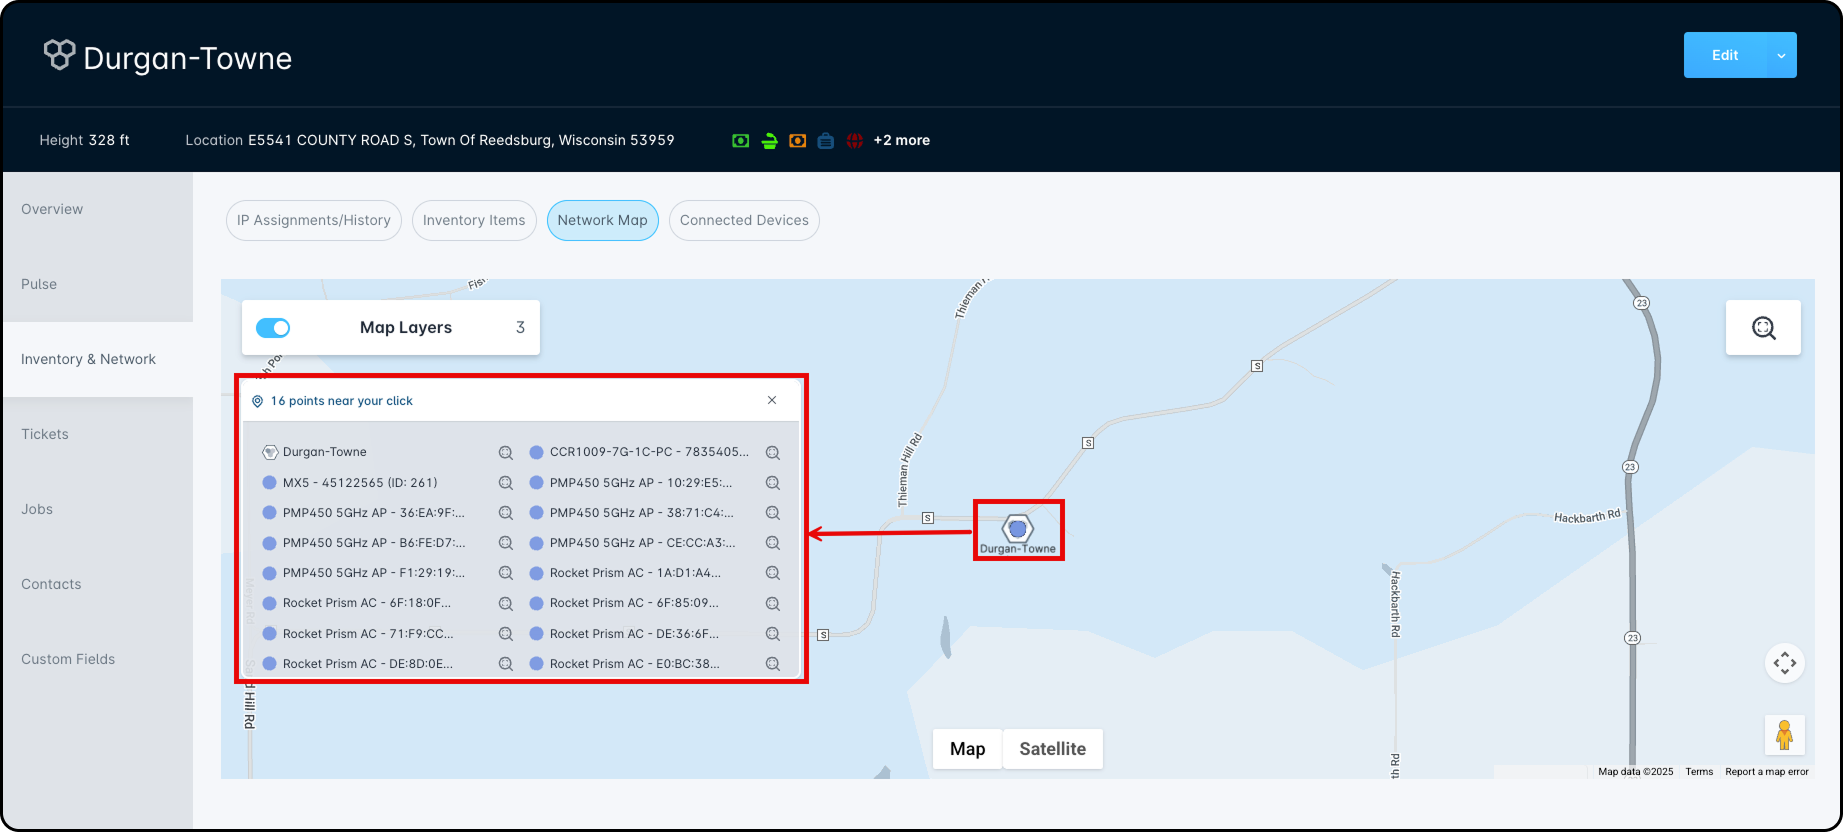
“Points near your click” is another useful tool integrated into the network map. By clicking on a network site, you're able to populate a new modal that lists any nearby network sites, along with any inventory equipment associated with that site.
When this list is visible, you're able to dig into the associations either by clicking on the item name to populate a sidebar menu specific to that line item. Additionally, you can zoom into the item location by clicking on the zoom icon to the right of the item, or highlight the item on the map by hovering your mouse over one of the listings.
The maximum number of items that can display in the “points near your click” pop-out is 50.
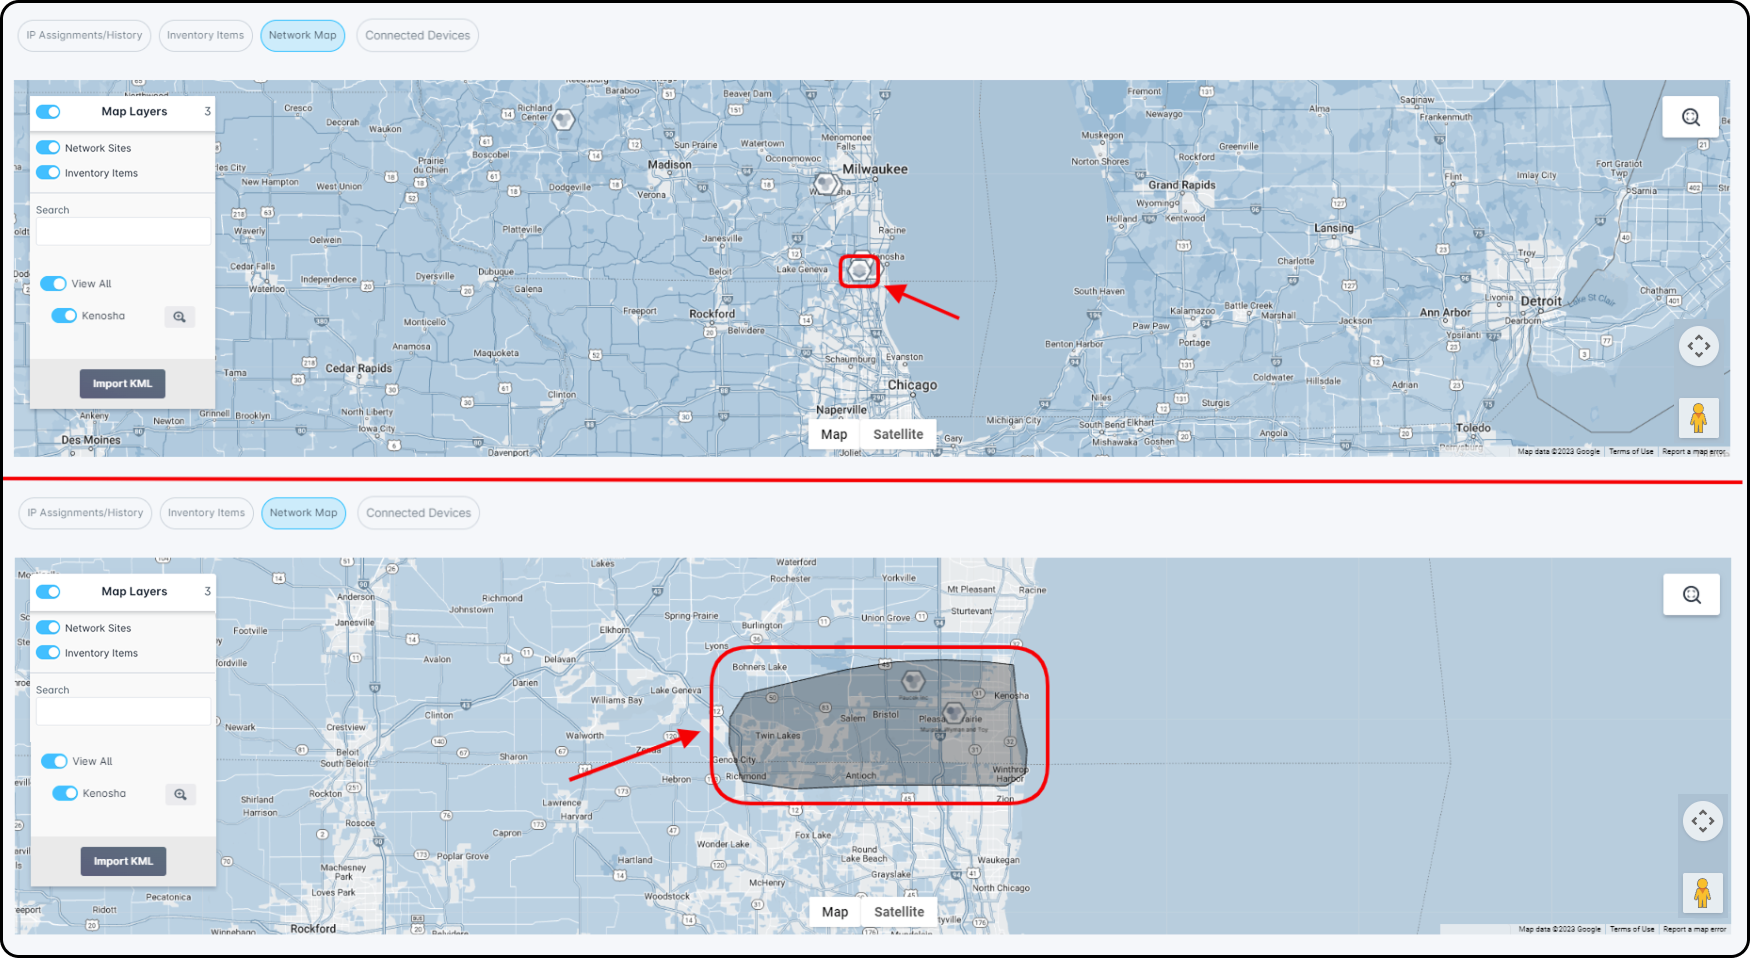
Once custom overlays have been associated with a network site, they'll be visible in the network map interface. The size of the overlay depends on how far you have to zoom in to be able to see the boundaries. In our example below, we can see the larger boundary as highlighted toward the bottom of the map, whereas the icon highlighted above it reflects a smaller boundary. In addition to using the “+” icon on the map itself, or using the scroll wheel on your mouse, you're able to quickly zoom into a custom overlay by clicking on the magnifying glass icon alongside an overlay name.
Connected Devices
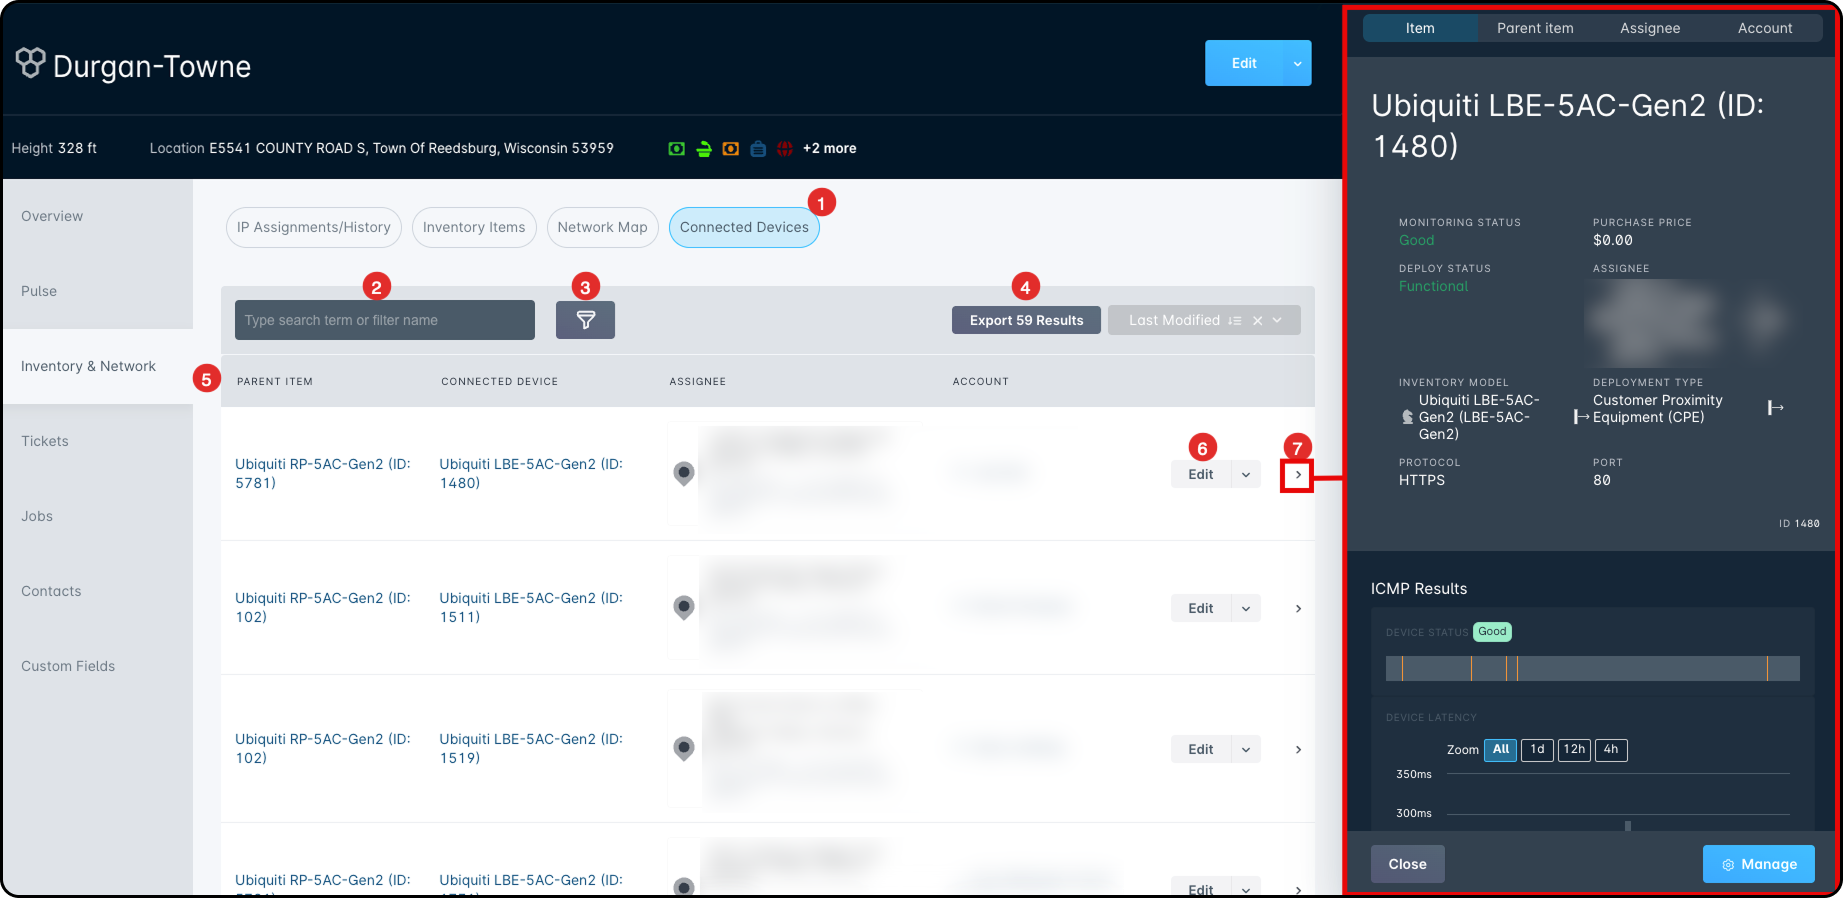
Connected Devices tab: This denotes which section of the Network and Inventory menu you're in. Currently, the Connected Devices tab is selected.
The Search field allows you to search for a device or IP address by typing in its information
The Filterbutton will open the Filter editor, which allows you to choose a preset filter and then narrow down the subset items.
For more information on Filtering, refer to this article.
Export [X] Results: This button allows you to export a list of Inventory Devices on this Network Site out of Sonar as a JSON or CSV formatted file.
The Connected Devices table lists information pertaining to the device(s) operating on this Network Site:
The Parent Item on the Network site.
The Connected Device downstream.
The Assignee details, as a Serviceable Address.
The Account details, applicable when assigned to an account versus another Network Site.
The Edit button, which allows you to modify information related to the Parent Item. It can also be expanded using the dropdown arrow to provide a variety of other control features.
These options are identical to those present in the Inventory Item sub-tab, as the Edit process runs against the item(s) added to the present Network Site.
Clicking on the sideways arrow will open the Sidebar, which contains additional information related to the fields covered in the table. These fields can be changed using the tabs at the top of the sidebar.
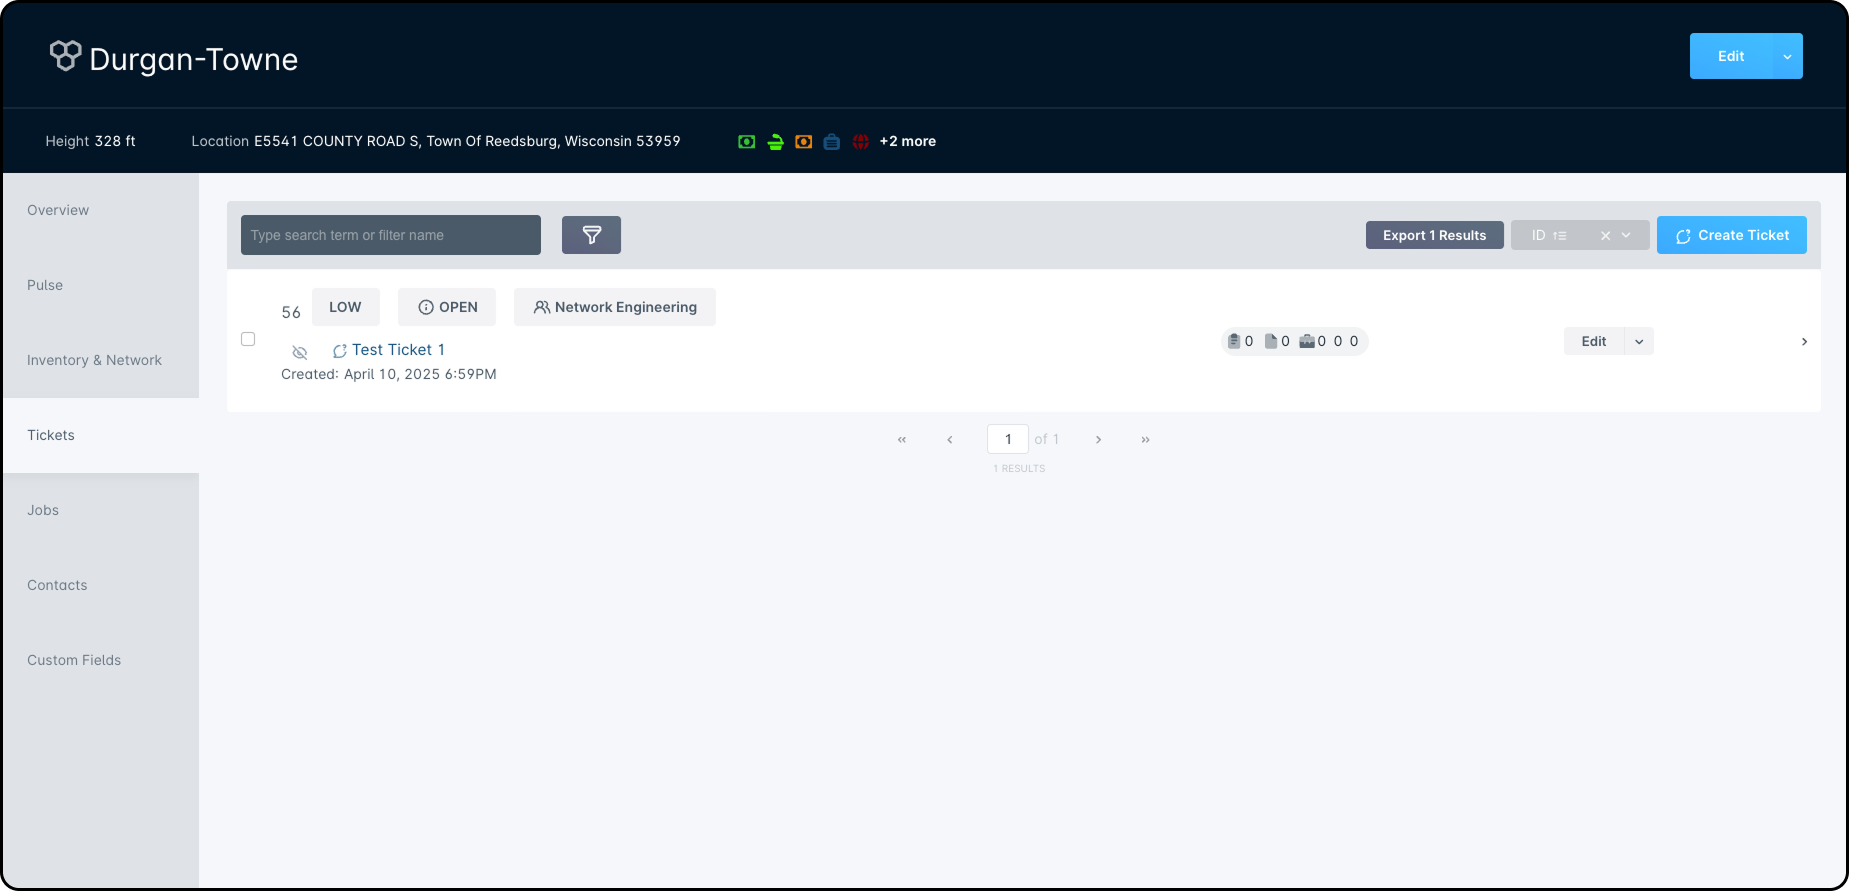
The Tickets Tab
The Tickets tab provides a detailed list of any current or historical tickets which are assigned to the currently viewed Network Site. The Tickets tab breaks the listed tickets down to similar categories when compared to the ticketing page itself.
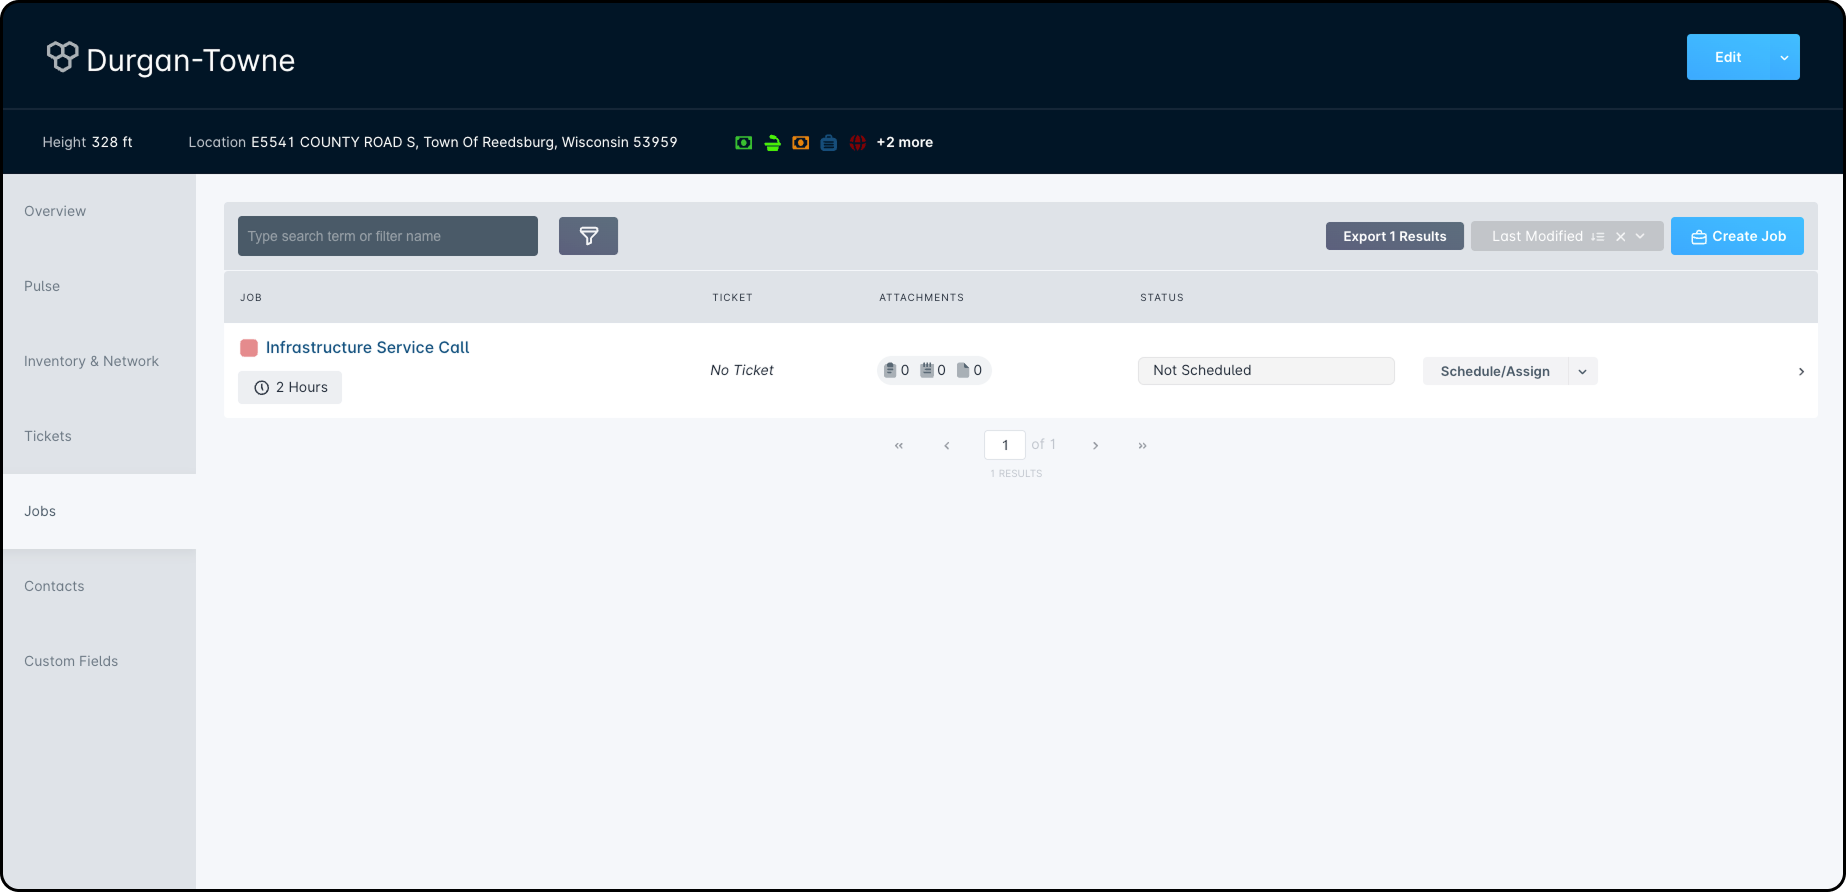
The Jobs tab allows you to see any jobs which are related to the Network Site being managed, providing insight into both active and historical jobs.
For more information on Jobs, refer to this article.
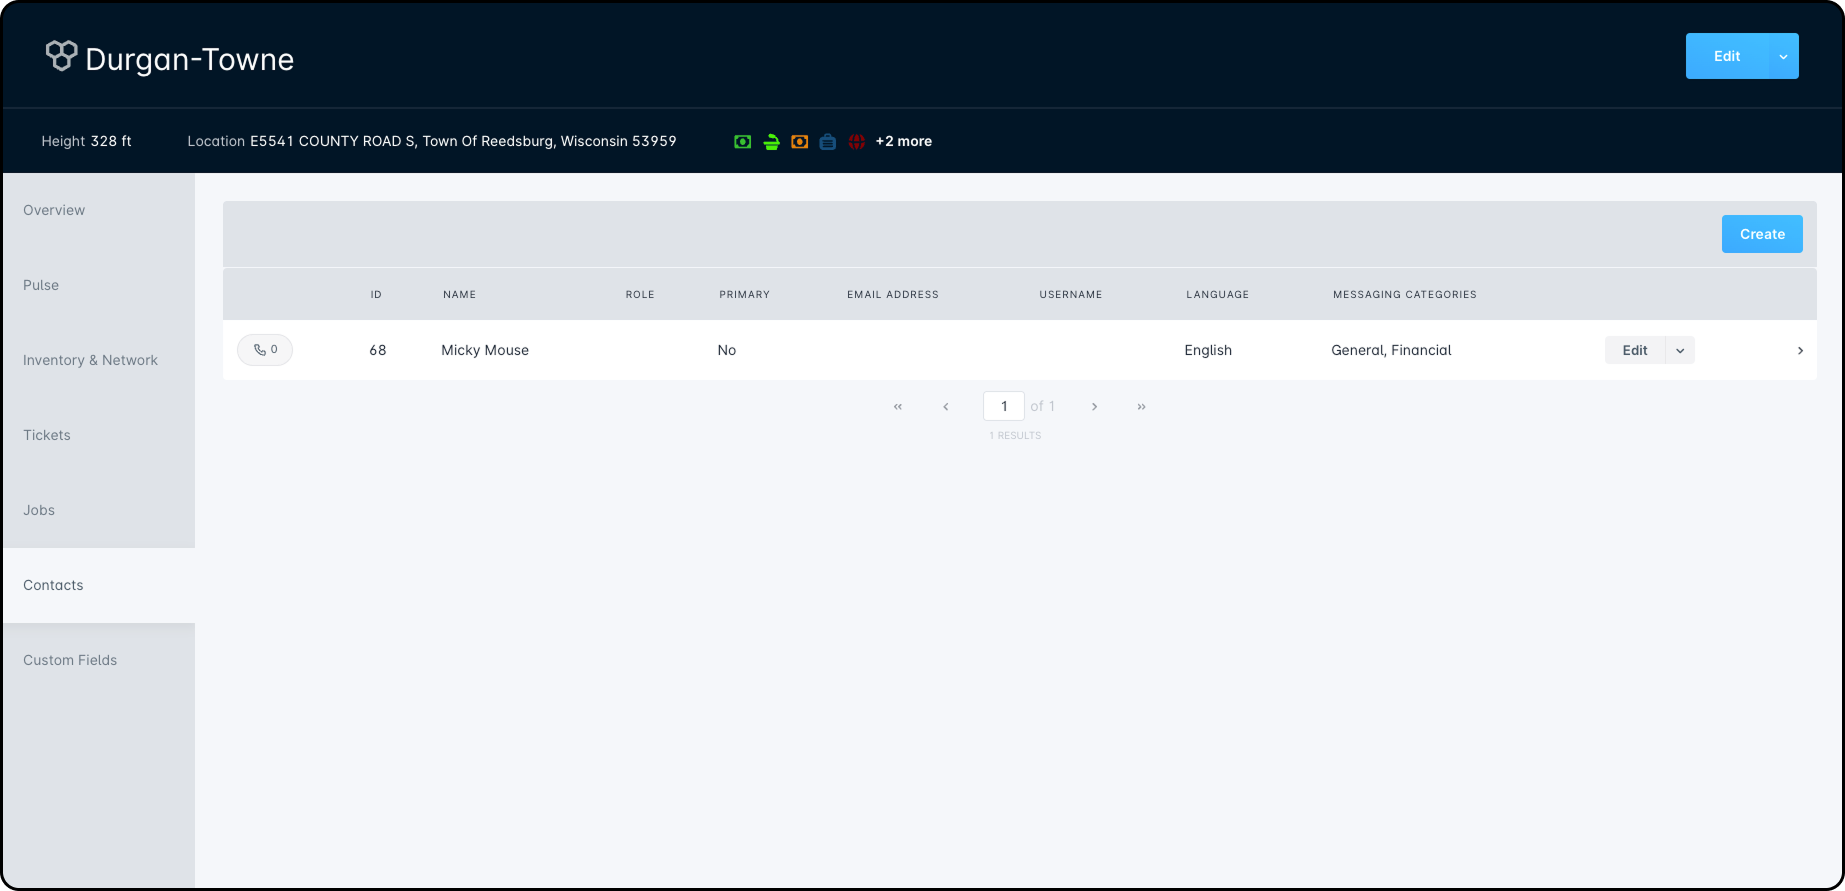
The Contacts Tab
The contacts tab will list any contacts associated with the Network site, designed to simplify the process of reaching out to important contacts when troubleshooting or resolving an issue surrounding the Network Site.
For more information on creating Contacts, refer to this article.
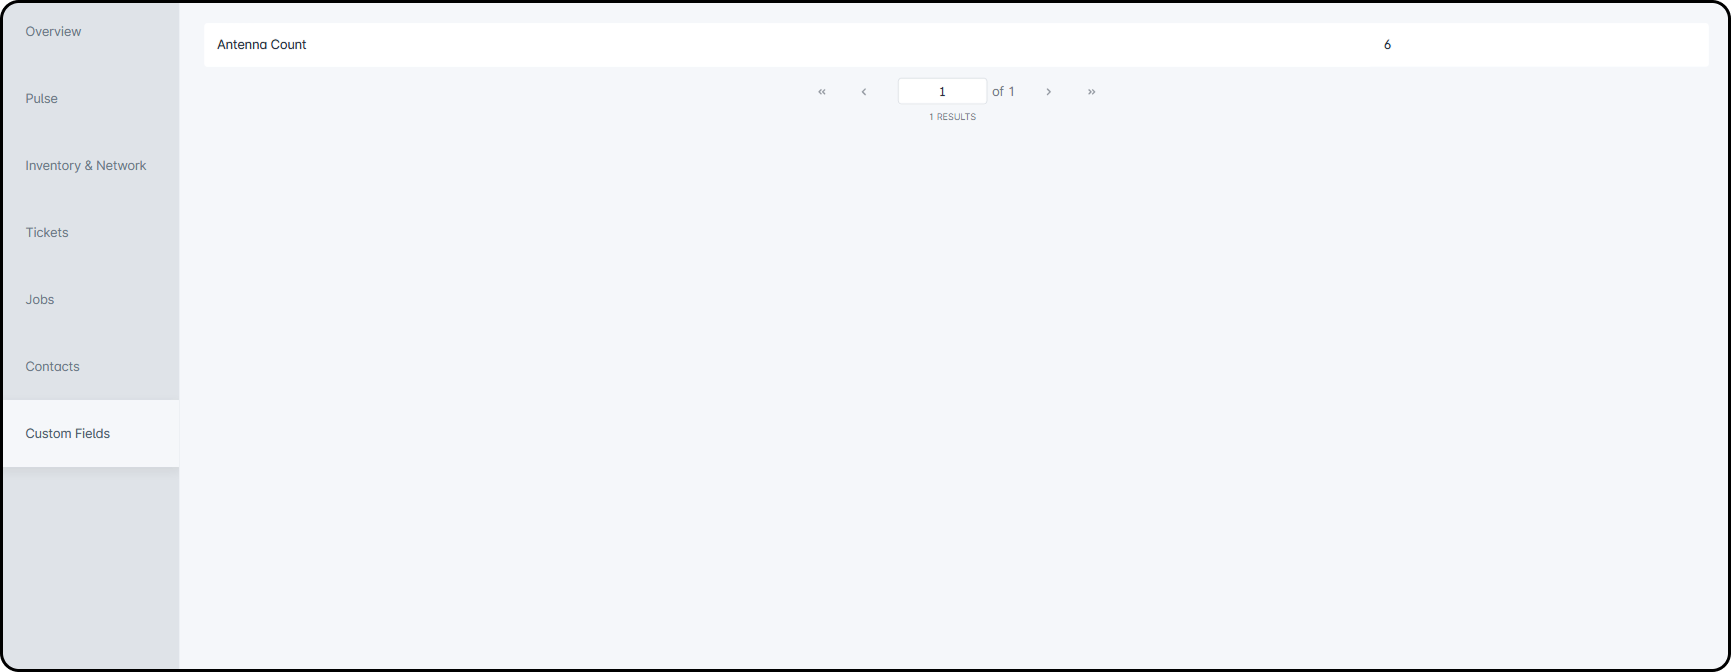
The Custom Fields Tab
The Custom Fields tab will display the same custom fields as the Overview tab and allows you to get a full view of all custom fields in use on the Network Site.
For more information on Custom Fields, refer to this article.
 Updated
by Mitchell Ivany
Updated
by Mitchell Ivany
 For more information on Filtering, refer to this article.
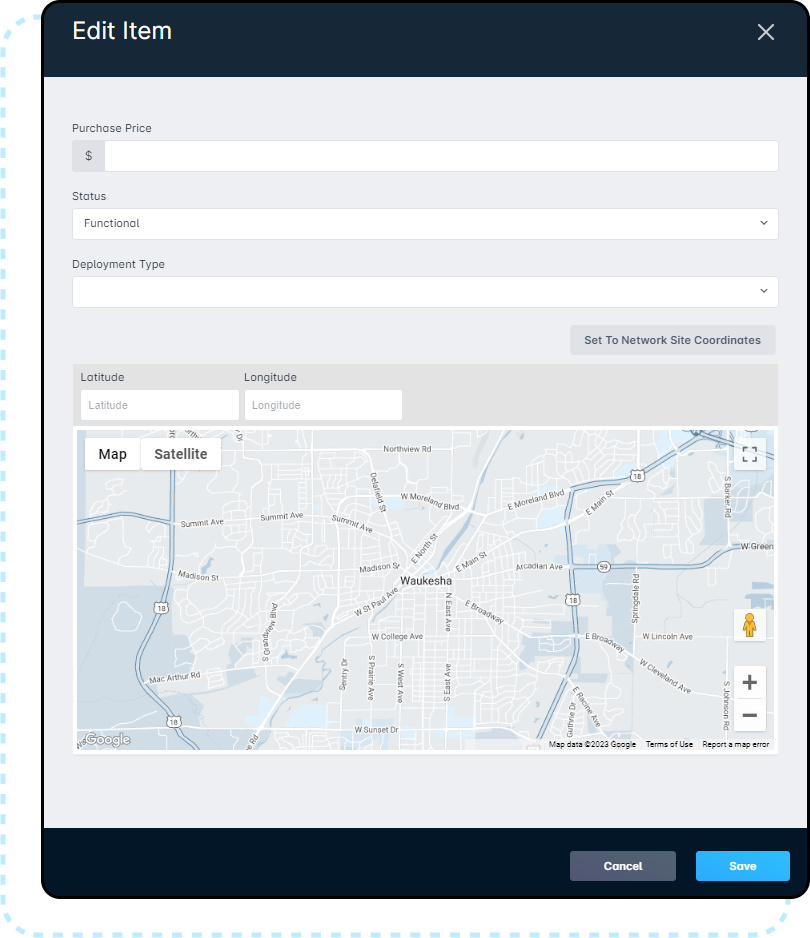 If inventory is moved from one network site to another, it'll automatically move to the new location on the network map. However, the visible coordinates will need to be manually set again.