Our Products & Services
Getting Started
First Time Setup
Getting Started with Inventory
Getting Started With Jobs
Getting Started with Accounts
Getting Started with Ticketing
Setting Sonar up for Billing
Baseline Configuration
How To: Using Sonar's Customer Portal
User Specific Resources
Accounts
Account Groups: Overview & Example Use Cases
Account List View: Overview
Account Management View: Overview
Account Overview Customization
Account Statuses: Overview & Example Use Cases
Account Types: Overview & Example Use Cases
Anchor & Linked Serviceable Addresses: Overview and Best Practices
Archiving an Account: Overview
CPUC Fixed Broadband Deployment by Address
Child Accounts: Best Practices & How Tos
Creating a New Account
Direct Messages: Overview
Disconnecting an Account
Disconnection Reason Management: Overview
Exploring Task Groups
FCC Broadband Data Collection (BDC) Filings: How Sonar Can Help
FCC Data Exports: General Overview and Usage
Future Serviceable Addresses: Overview
Lead Intake Form Processing
Notes: Best Practices & Use Cases
Scheduled Events: Overview & Use Cases
Serviceable Addresses: Overview and Usage
Specify Account ID upon Creation
Tasks & Task Templates: Overview
Using Sonar's FCC Broadband Label Generation Tool
Billing
ACH Batching: Overview
Accounts in Vacation Mode
Avalara: Overview & Setup
Batch Payments & Deposit Slips: Overview
Billing Calculator
Billing Defaults
Billing Settings
Building Packages
Building a Data Service
Canadian ACH tool
Changing Service Pricing in Sonar: Best Practices
Configure Service Eligibility Criteria: Overview
Considerations When Using Avalara with Voice Services
Creating Discounts for Services and Packages
Delinquency Billing Best Practices
Delinquency Exclusions: Overview
Dual Data Services: Overview
Email Invoice Batch: Overview
General Ledger Codes: Overview
General Transactions: Best Practices
How Sonar Prorates Billing
How to Take Bank Account Payments
How to Use SKUs: Overview
How to: Adding a Service to an Account
Invoice Templates: Overview
Leveraging PayPal as a Payment Method in Sonar
Manual Transactions
Multi-Month Billing & Multi-Month Services
Print to Mail
Printed Invoice Batches: Overview
Reversals and Refunds: Overview
Services: Overview
Setting Up Payment Methods and Taking Payments
Setting up Bank Account & Credit Card Processors
Taxes Setup
Usage Based Billing Policies: Overview and Usage
Usage Based Billing Policy Free Periods: Overview and Usage
Using Tax Exemptions - How To
Communication
Communications: Call Logs Overview & Best Practices
Communications: Messages Overview
Email Variables & Conditions
Message Categories: Overview & Use Cases
Phone Number Types: Overview and Use Cases
Saved Messages: Overview
Setting up an Outbound Email Domain
Trigger Explanations
Triggered Messages: Setup
Using Outbound SMS
Using the Mass Message Tool
Companies
How to: Setting Up a Company in Sonar
Managing Multiple Companies in Sonar: Best Practices
Rebranding your Sonar Instance
Field Tech App
Financial
Agreement Templates
Invoice Attachment Use Cases & PDF Examples
Invoice Messages: Overview & Use Cases
Invoices in Sonar: Examples, Creation & Contents
Integrations
Atlas Digital CORE Integration
Calix Cloud Data Field Mappings
Calix SMx Integration: Overview
CrowdFiber Integration
External Marketing Providers
GPS Tracking Providers: Overview
GoCardless Integration: Overview & Setup
Handling Static IPs with the Calix SMx Integration
How to Connect Cambium to your Sonar Instance
How to Connect Preseem to your Sonar System
How to: Using Webhooks in Sonar
Integrating with Calix Cloud
RemoteWinBox - Integration with Sonar
Sonar Retain: AI-Powered Customer Retention & Quality Intelligence
Tower Coverage Integration: Overview
VETRO FiberMap V2 Integration: Overview
VETRO FiberMap V3 Integration: Overview
Webhook Events: Overview
Webhooks in Sonar: Basic PHP Example
iCalendar Integration
Inventory
Inventory List View: Overview
Inventory Model Management: General Overview
Network Inventory: How-to & Usage Guide
Segmentable Inventory: How-to & Usage Guide
Setup of Inventory: Manufacturers, Categories, and Assignees
Tracking and Using Consumable Inventory
Jobs
Applying Task Templates to Jobs
Edit Job Options
Example Jobs & Templates
Geofences: Overview
Job Types: Best Practices
Jobs and Scheduling: Overview
Scheduling Dispatcher View: Overview
Scheduling How-to: Creating and Booking a Job
Scheduling Table View: Overview
Scheduling Week View: Overview
Setting Up Schedules General Overview
Mapping
Misc.
Combining Custom Fields & Task Templates for Information Storage
Custom Fields Overview & Use Cases
Custom Links: Overview
Task Templates Overview & Use Cases
Monitoring
Building Alerting Rotations
Building a Monitoring Template
Poller Troubleshooting
Pollers: General Overview, Deployment Strategy, Build Out & Setup
Networking
Adtran Mosaic Cloud Platform Integration: Overview
Assigning RADIUS Addresses
Assigning an IP Address Using Sonar's IPAM: How to
Automating IP Assignments, Data Rates, and Network Access in Sonar
Building Address Lists
Building RADIUS Groups
Building a Device Mapper
Cable Modem Provisioning
Controlling Customer Speeds with Sonar: General Overview
DHCP Delivery
Data Usage Available Methods
Finding your OIDs
FreeRADIUS 3: Build-Out & Integration
How Sonar Communicates - Egress IPs Explained
IP Assignments & Sonar
IPAM: Basic Setup
IPAM: Overview
LTE Integration
MikroTik as an Inline Device: Integration With Sonar
MikroTik: Controlling Access
MikroTik: Controlling Speeds
MikroTik: Setting Up a Sonar Controlled DHCP Server
Netflow On-Premise Integration: Setup and Overview
Network Dashboard: Overview
Network Sites: Management View Overview
PacketLogic: Integration With Sonar
Pulse, Polling, and PHP
RADIUS: Build-Out & Integration with Sonar
RADIUS: Building Reply Attributes
Setting Up CoA Proxy
Sonar Flow
Sonar IP Addressing
Using Multiple Network Devices in Sonar
Purchase Orders
Release Notes
Reporting
Common Custom Report Uses
Enhanced Business Intelligence - Tips & Tricks for Advanced Users
How To Enhance Your Reporting With Custom Field Data
How to Unpublish a Report or Dashboard
Managing Scheduled Reports
Report Licenses
Reporting Time Zone Behavior
Sonar's Business Intelligence: Overview
Understanding Sonar Reports
Using Sonar DataConnect to Connect BI Applications with Your Sonar Instance
Security
Application Firewall: General Overview and Best Practices
Auth0: Overview
Multi-Factor Authentication: Overview
Password Policy In Depth
Removing a Terminated Employee In Sonar
Role Creation using GraphiQL
User Role Creation & Best Practices
Users: Overview
Sonar Billing
sonarPay
How to Find Your Processing Rates in the sonarPay Portal
Reconciling sonarPay Disbursements with Bank Deposits
What to Expect After sonarPay Enrollment
sonarPay Canada Disbursements: Overview
sonarPay Chargebacks & Disputes: Overview
sonarPay Disbursements: Overview
sonarPay Migration: Approving Your Match & Going Live
sonarPay Migration: The Token Transfer & Matching Process
sonarPay Monthly Statement: Overview
sonarPay Overview
sonarPay Reversals, Voids, & Refunds: Overview
sonarPay: Token Migration Process
System
A Deeper Dive into the New Sonar API
API Calls Using Third Party Applications: Personal Access Tokens
Browser Compatibility and Minimum Hardware Requirements for Sonar
Consuming the Sonar API
Controlling Your Landing Page: Personal Preferences
Customizing Your Customer Portal
Date/Time Picker: Overview
Dynamic Time Zones in Sonar
Filtering: Overview
Frequently Used Terms
Getting Your Data into Sonar
GraphQL Rate Limiting Overview
How To Use GraphiQL to Understand the Sonar API
How Your Data is Backed Up
How to Best Use Global Search
Interacting with Files via the API
Introducing the New Sidebar
Main Menu: Overview
Mutations in the Sonar API
Notification Preferences
REST API Wrappers for V1 Compatibility
SMS Notifications
Sonar's Rich Text Editor
System Settings: Overview
The New Sonar API
Troubleshooting the Customer Portal
Upgrading your Ubuntu OS - Customer Portal Upgrades
User Profile: Your Personal User Settings
View History & All Logs: Overview
Ticketing
Advanced Ticketing Features
Canned Replies Examples & Templates
Canned Reply Categories
Exploring Ticket Groups
How Sonar Manages Spam Tickets
How to Integrate Inbound Mailboxes with Slack
Inbound Mailboxes Example Build
Ticket Category Families & Ticket Categories: Overview
Ticket Resolution Reasons: Overview
Ticketing: Overview
Using Parent Tickets
Voice
API Changes for Voice Billing
Best Practices to Remain CPNI Compliant
Billing Voice Services in Sonar
Deploying Voice Services in Sonar
Working With the Sonar Team & Additional Resources
Sonar's Security Practices & Certifications
Security & Compliance
Sonar and General Data Protection Regulation (GDPR)
Technical Security Overview
Best Practices for Fast Tracking a Support Request
Feedback Portal / Suggest a Feature
Learning with Sonar: Tools and Resources
New Client Training Overview
Sonar Casts Table of Contents
Submitting Bugs vs. Feature Requests
The Sonar Community Forum
The Sonar Status Page
Third Party Customer Support Referrals
Where Sonar Stores Your Data
Table of Contents
- All Categories
- Monitoring
- Building a Monitoring Template
Building a Monitoring Template

Read Time: 5 mins
What is a monitoring template:
A monitoring template in Sonar is a template that can be applied to specific device models or deployment types to monitor them.
Creating your monitoring template
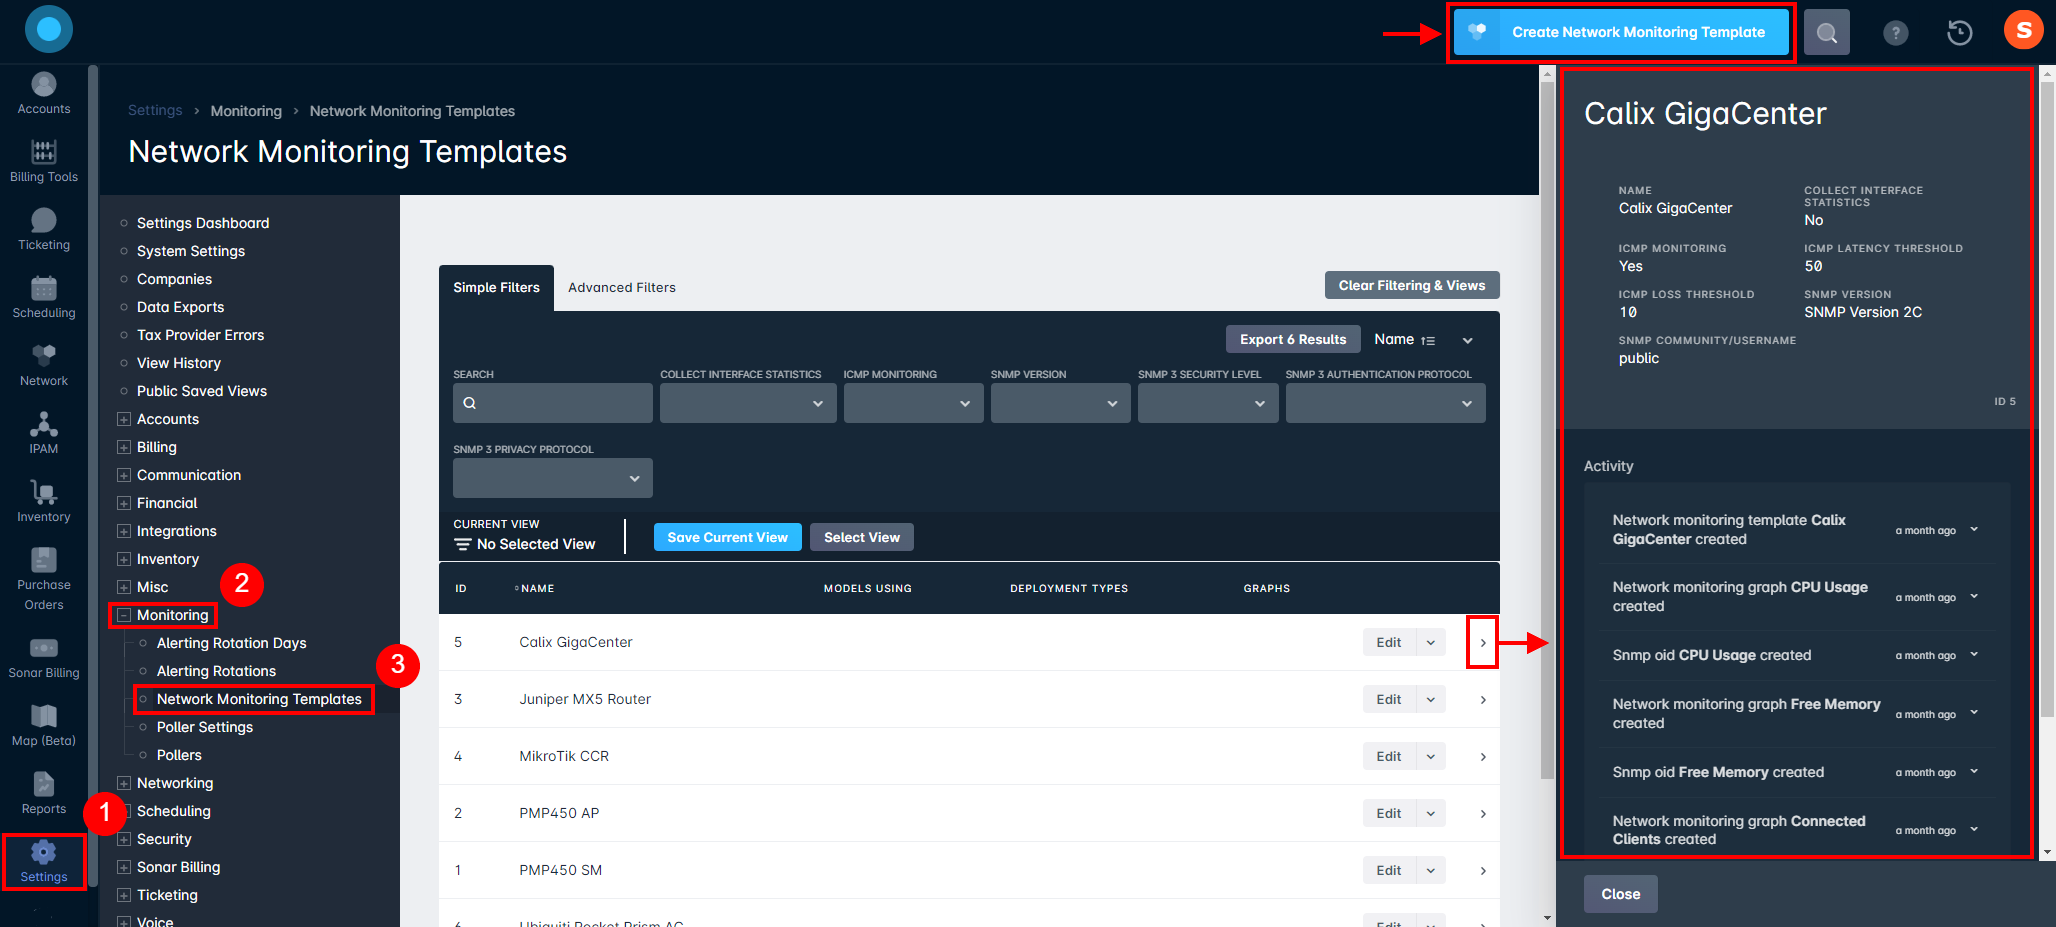
Monitoring Template creation occurs in multiple stages upon accessing the Settings page and clicking on the Create Network Monitoring Template button:
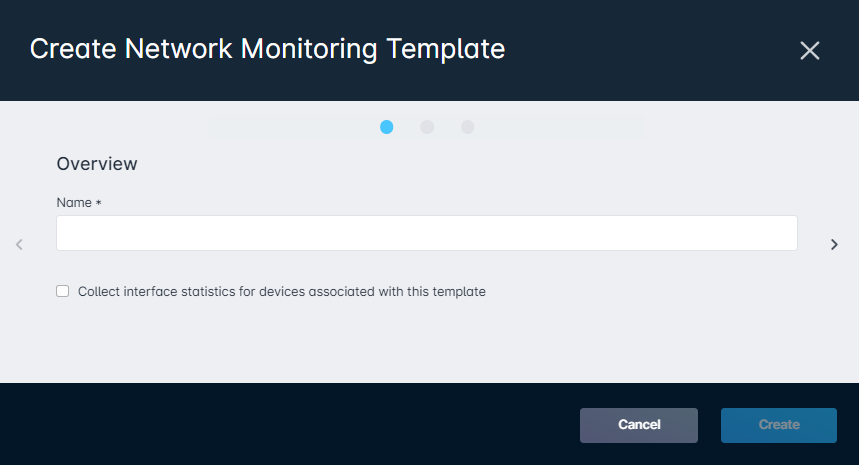
- Name: The name of the monitoring template. The name should describe what kind of device you will monitor.
- Collecting Interface Statistics: Having this box checked will gather specific stats for this device. For example, it will try to get all the MAC addresses associated with this device and certain stats like the speeds or throughput for each port.
- To view your Interface statistics, you will need to go into the Pulse tab under the Network Site management page and click on a device. This will populate a sidebar reflecting the device interface information.
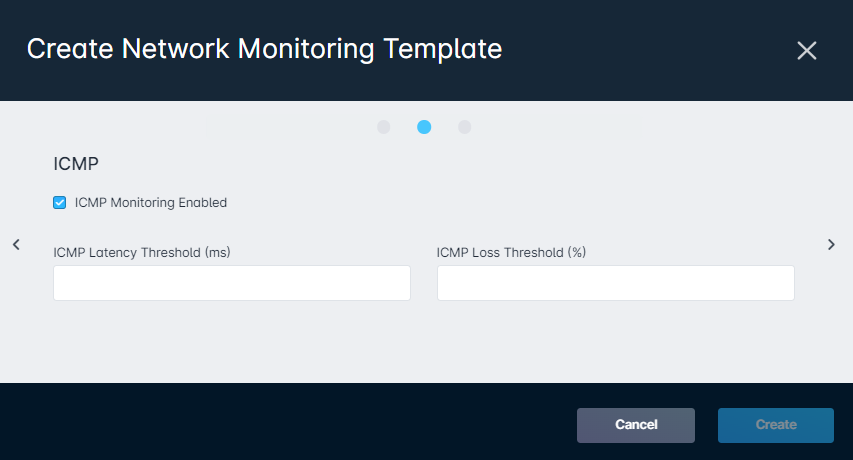
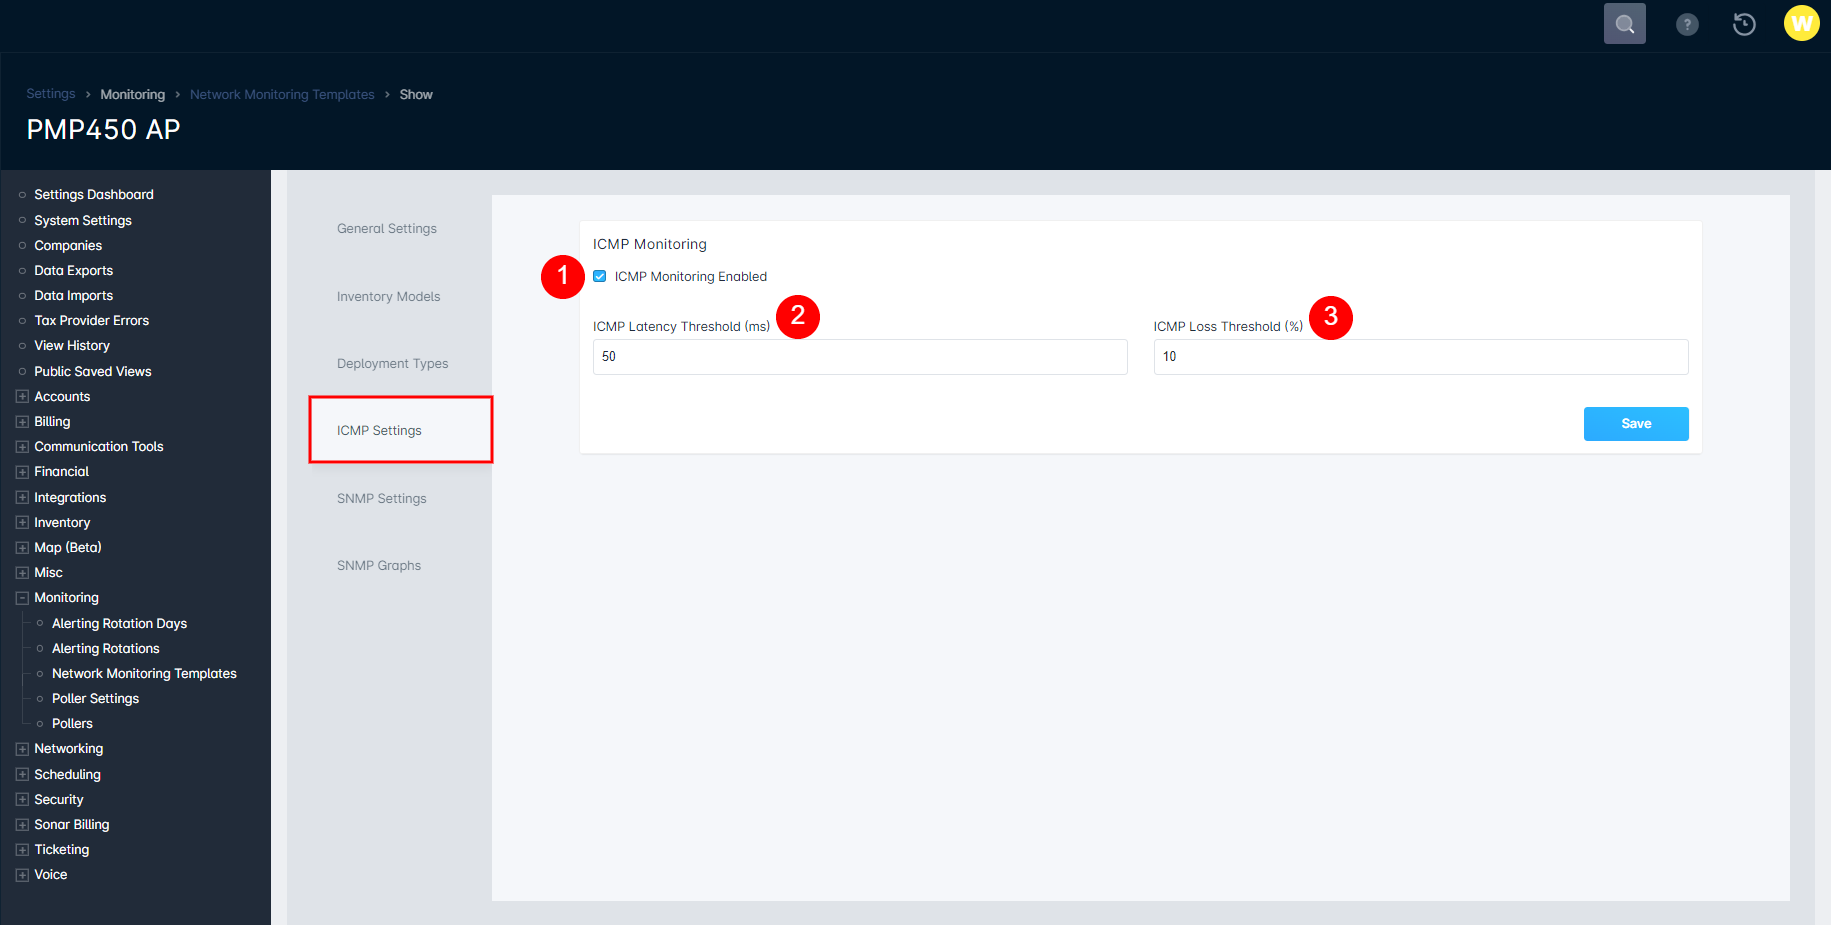
- ICMP Monitoring: When ICMP monitoring is enabled, you can define the latency threshold and packet loss threshold. If any of the above conditions are met or exceeded, the device is considered down in Sonar.
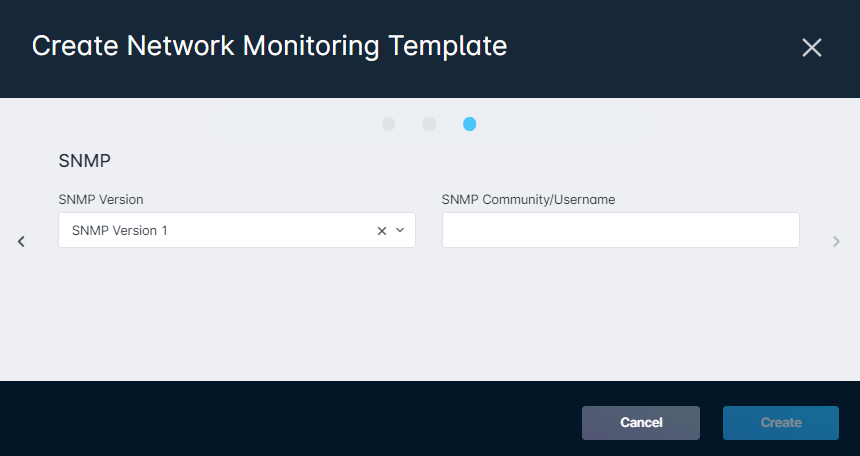
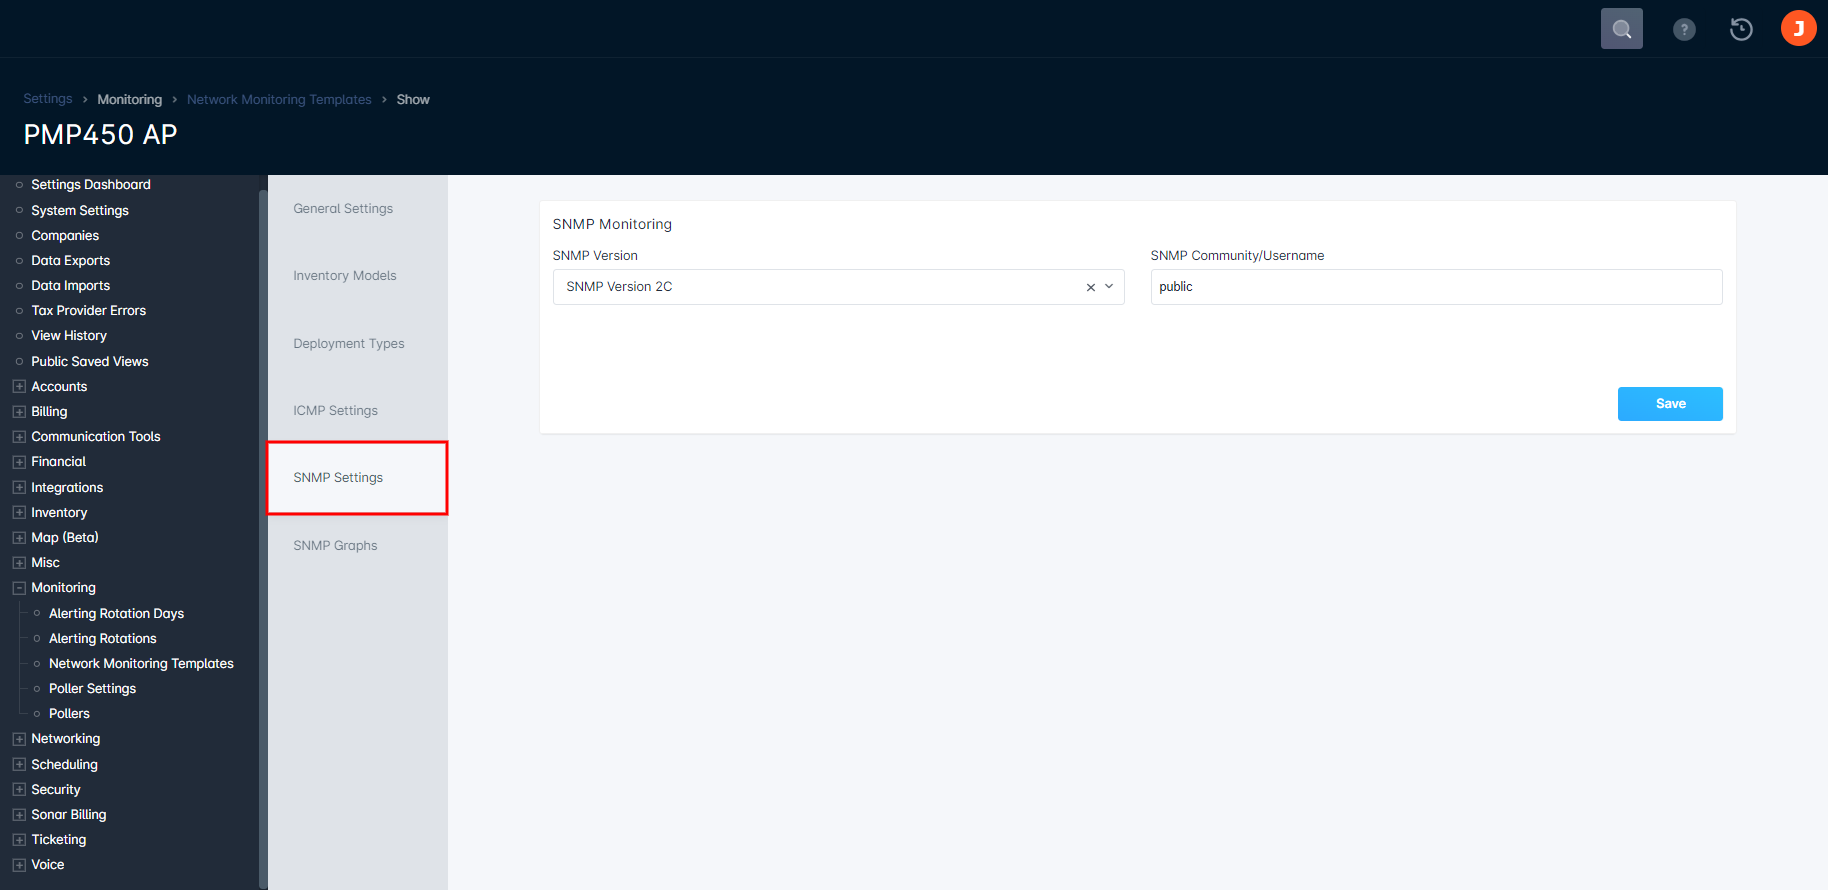
- SNMP Monitoring: SNMP monitoring allows for better monitoring of your devices. When SNMP monitoring is enabled, you need to define the version supported by your device, and also the community string. A community string functions like a password.
- Version 1: The oldest SNMP version available. All devices support this version, although it is not the most secure and should not be used if version 2c or 3 is available. Note: all Ubiquiti devices support v1 only.
- Version 2c: Version 2 is the most popular version being used, and it supports 64 bit counters.
- Version 3: is the newest and most secure version of SNMP. It is important to note that not all devices support V3.
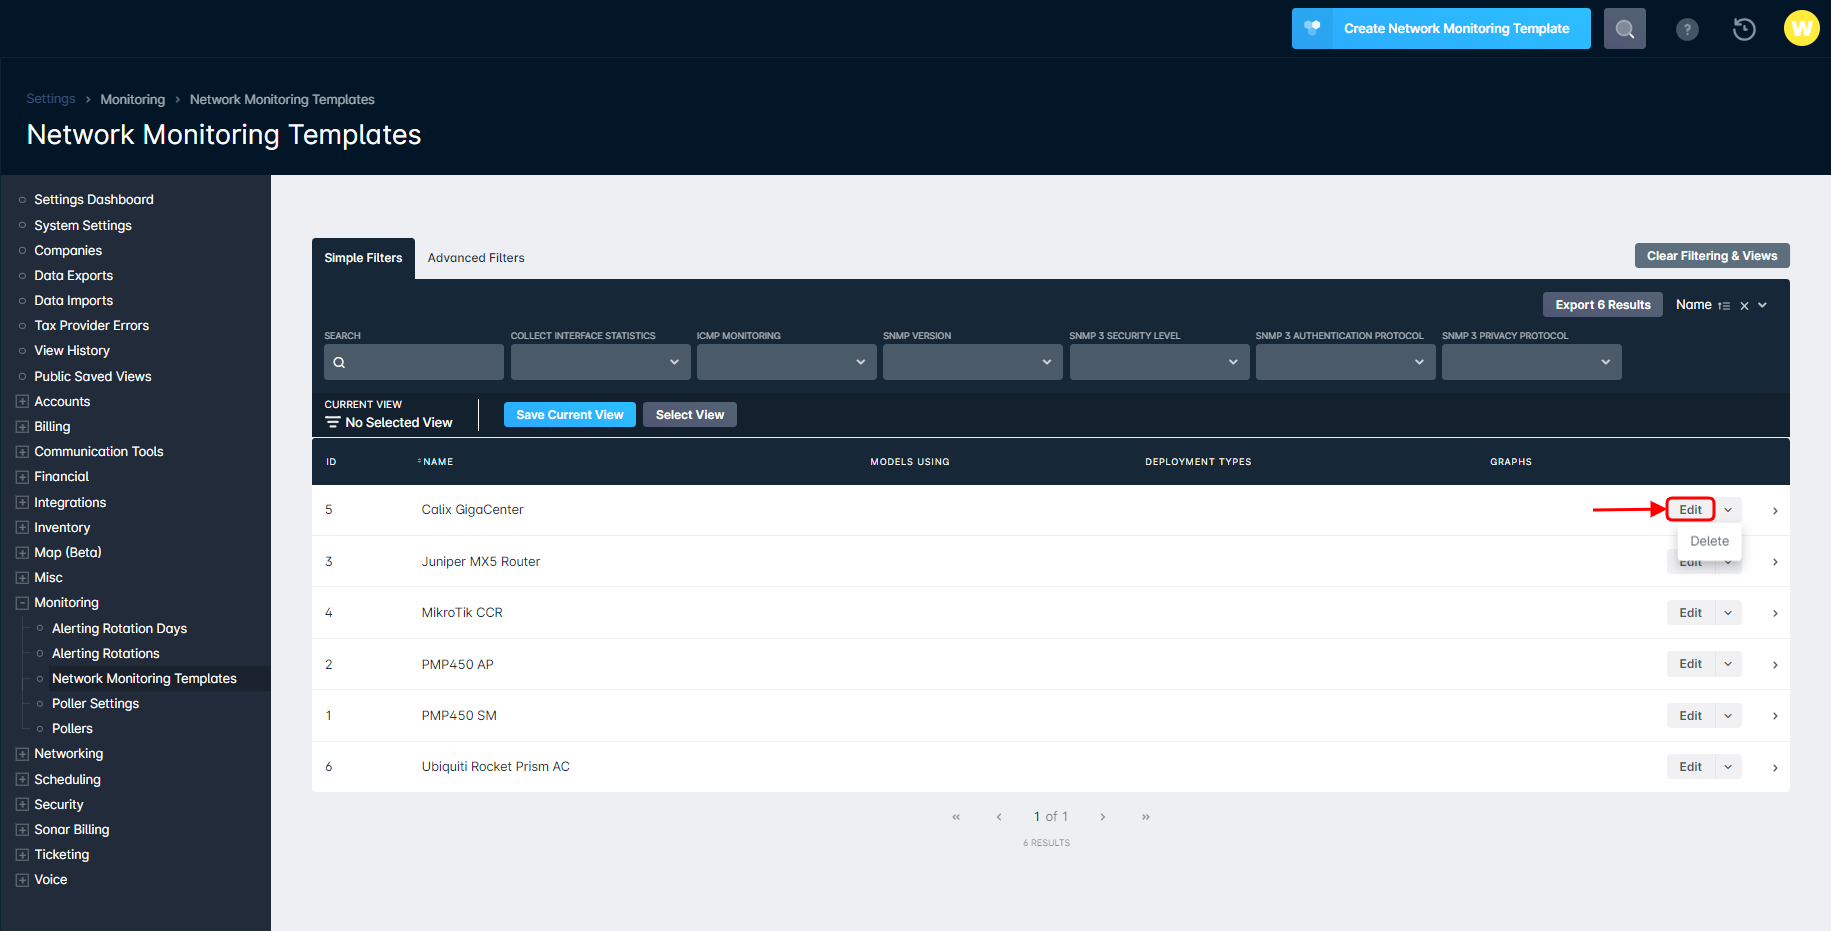
Editing Your Monitoring Template
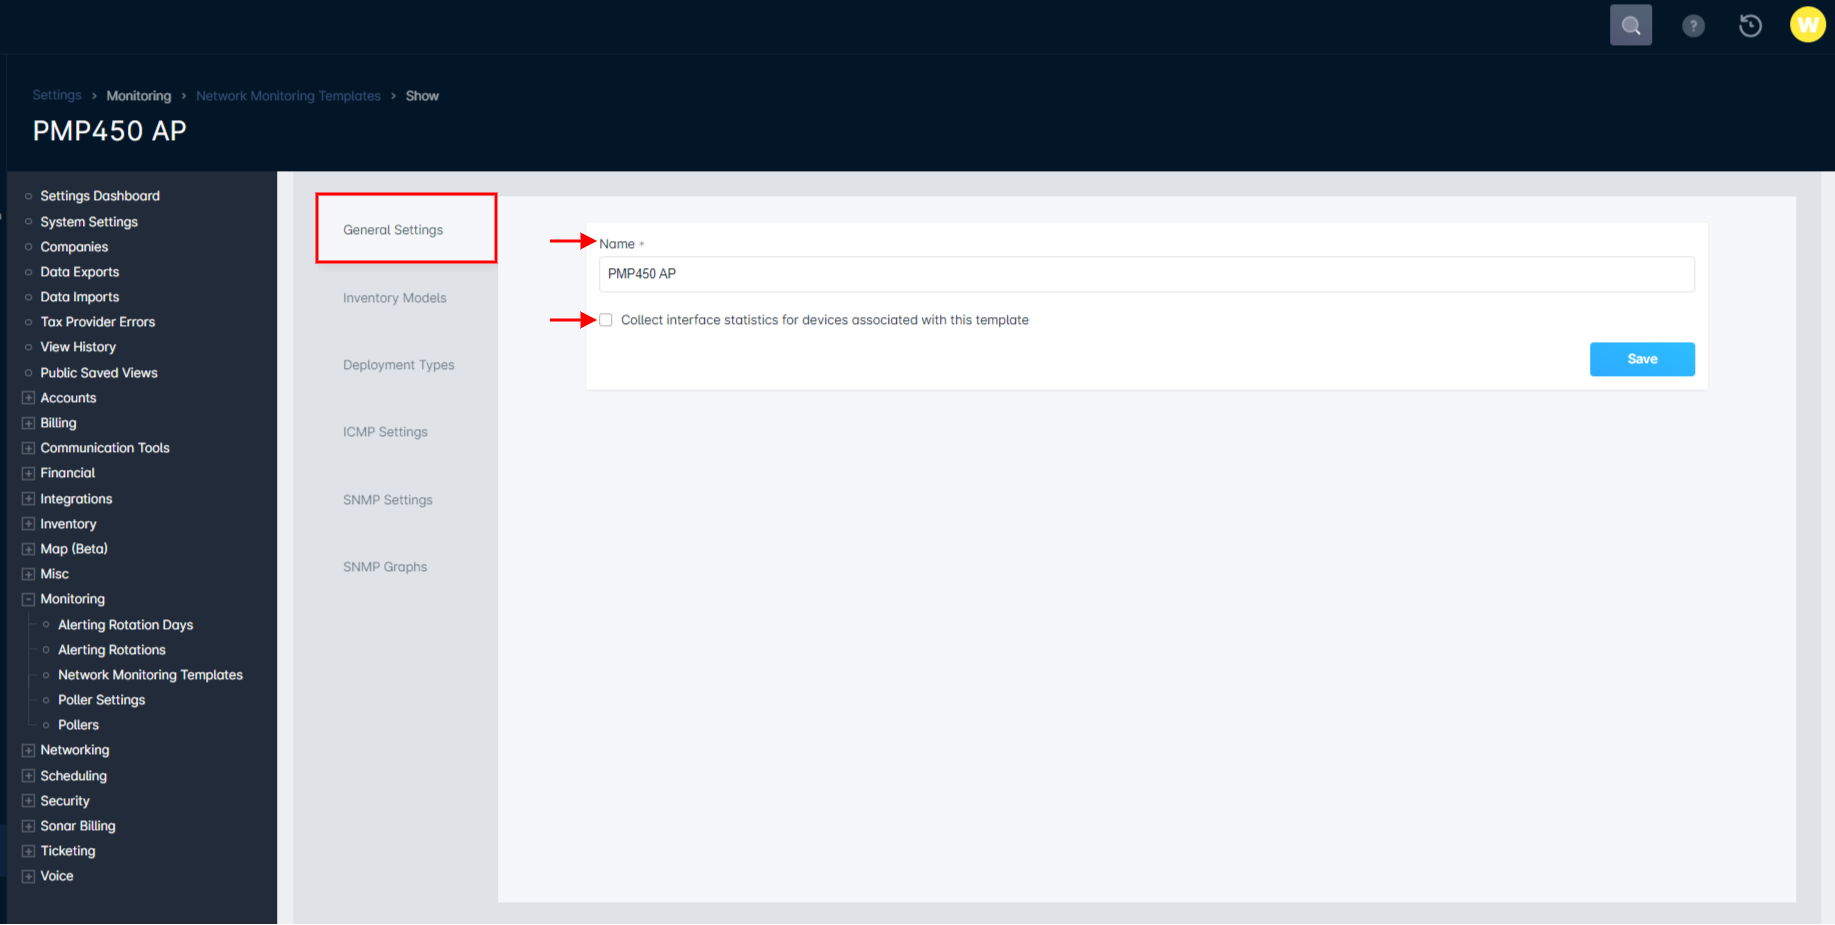
Once you've created your monitoring template, you can then edit the information and settings associated with it by clicking “Edit” on the corresponding line item. A new page will populate with the following tabs:
- General Settings allow you to rename the template and enable “Collect interface statistics for devices associated with this template”.To view your Interface statistics, you will need to go into the Pulse tab under the Network Site management page and click on a device. This will populate a sidebar reflecting the device interface information.
- Inventory Models allow you to add previously created inventory models that will be targeted for monitoring by that specific template. It is recommended to only monitor one manufacturer per template, as mixing manufacturers will make selecting the OIDs more difficult.
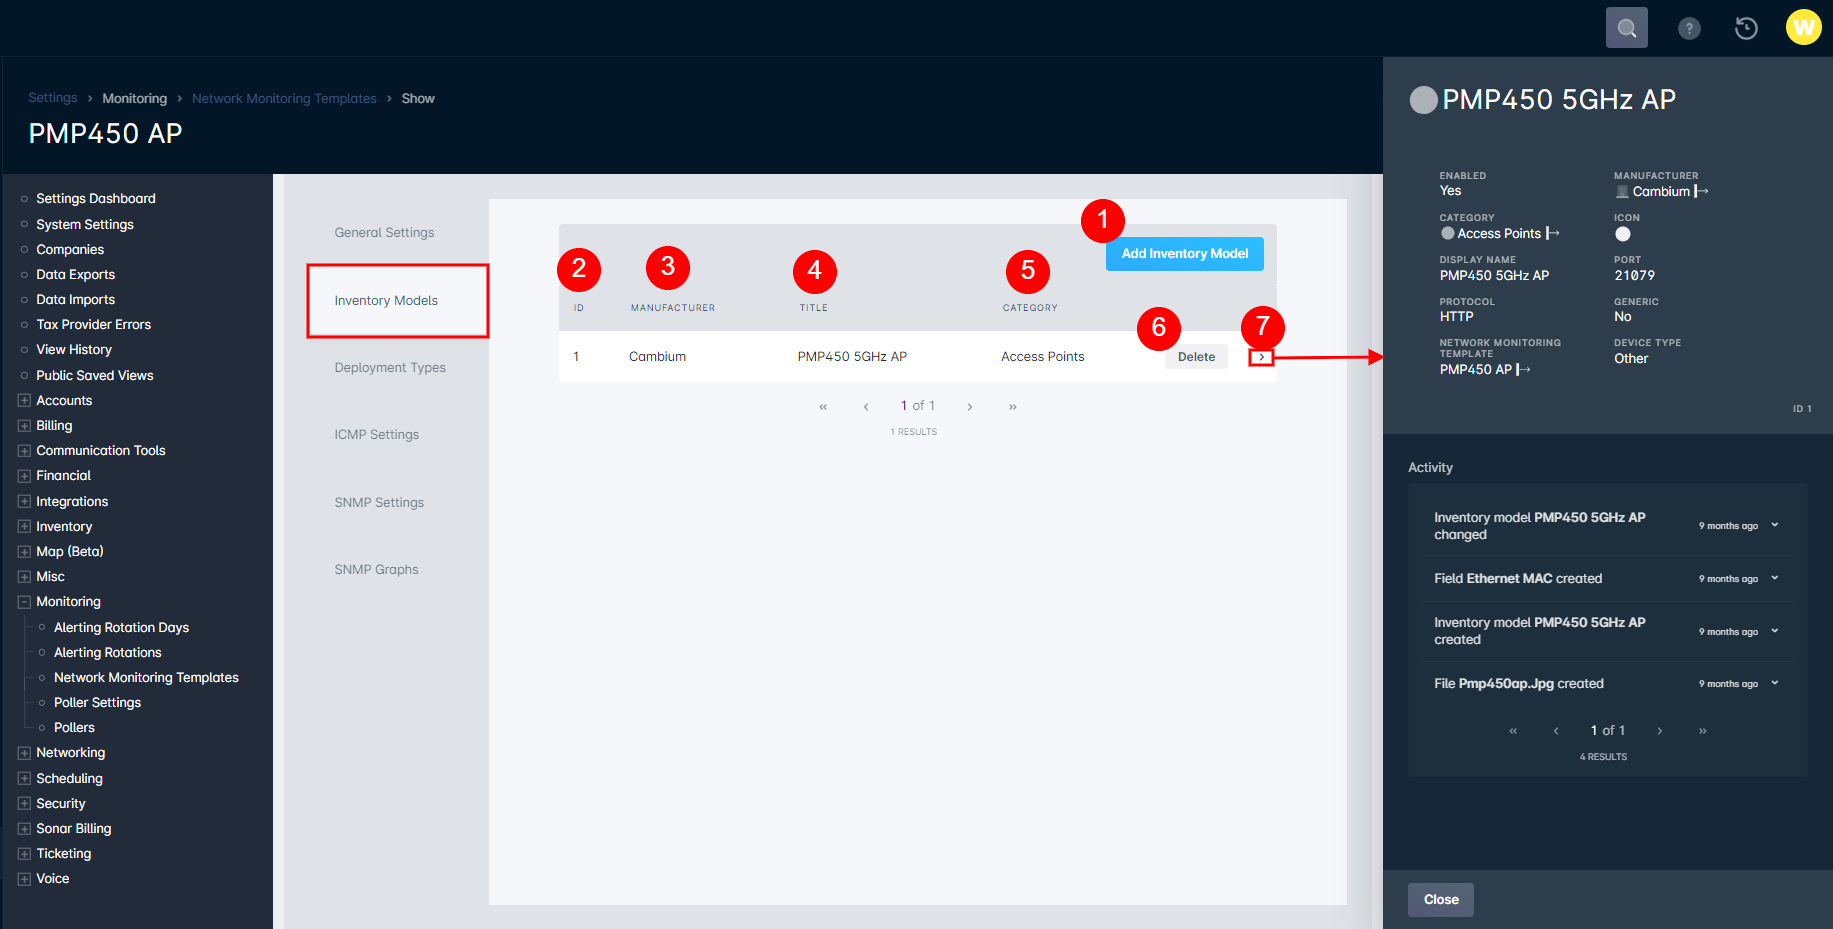
- Add Inventory Model button allows you to add individual inventory models for the monitoring template.
- ID column provides the identification number assigned to the inventory model for the monitoring template.
- Manufacturer column provides the name of the inventory manufacturer for the model selected.
- Title column provides the name of the inventory model selected.
- Category column provides the inventory category for the model selected.
- Delete button will remove the selected model from the monitoring template.
- Sidebar detail panel provides detailed information on the inventory model that is selected for the monitoring template.
- Deployment Types allow you to add further filtering to your monitoring template, allowing you to monitor specific deployments of the previously selected inventory models.
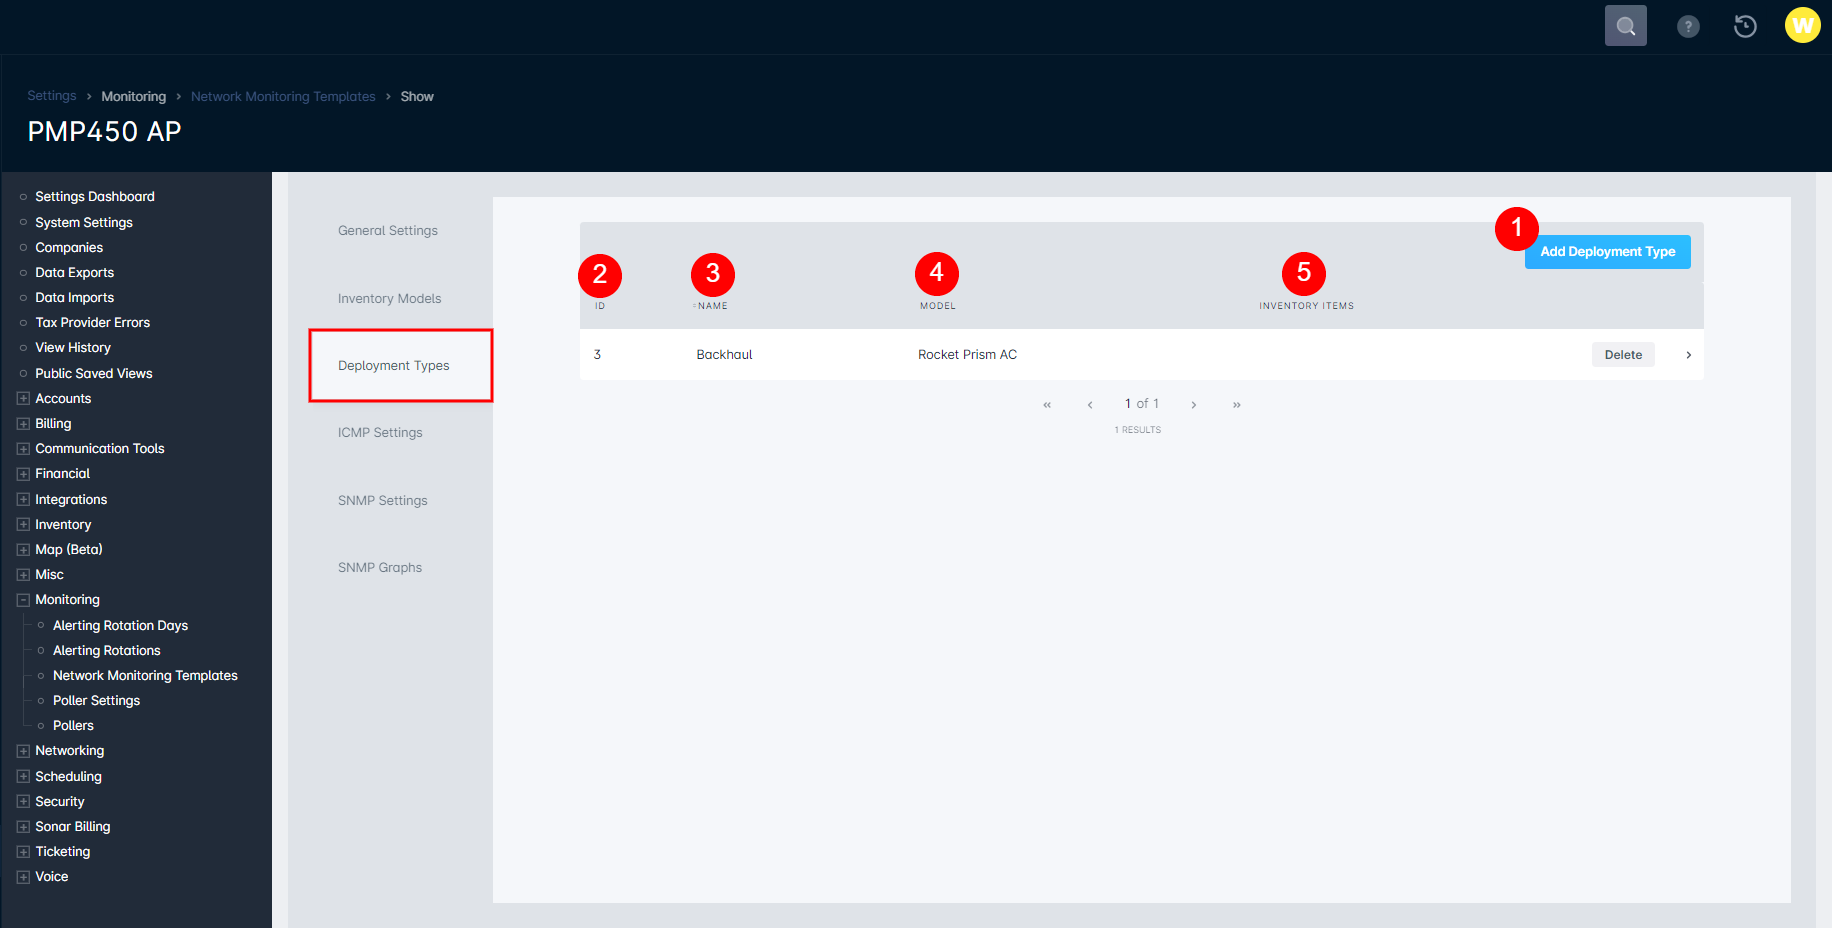
- Add Deployment Type button will provide a pop up window which allows you to select the correct deployment type for the inventory being assigned to the monitoring template.
- ID column provides the identification number assigned to the deployment type for the monitoring template
- Name column provides the name identification for the type of deployment that is selected.
- Model column provides the name of what model of inventory is selected with this monitoring template.
- Inventory Items column displays the number of inventory items that are set to that specific deployment type.
- ICMP Settings allow you to adjust the ICMP settings used when initially creating the monitoring template. Including enabling/disabling this setting and adjusting the latency threshold and loss threshold fields.
- SNMP Settings allow you to adjust the SNMP settings used when initially creating the monitoring template.
- SNMP Graphs provide access to creating an SNMP graph for your monitoring template, which we'll touch on further below.
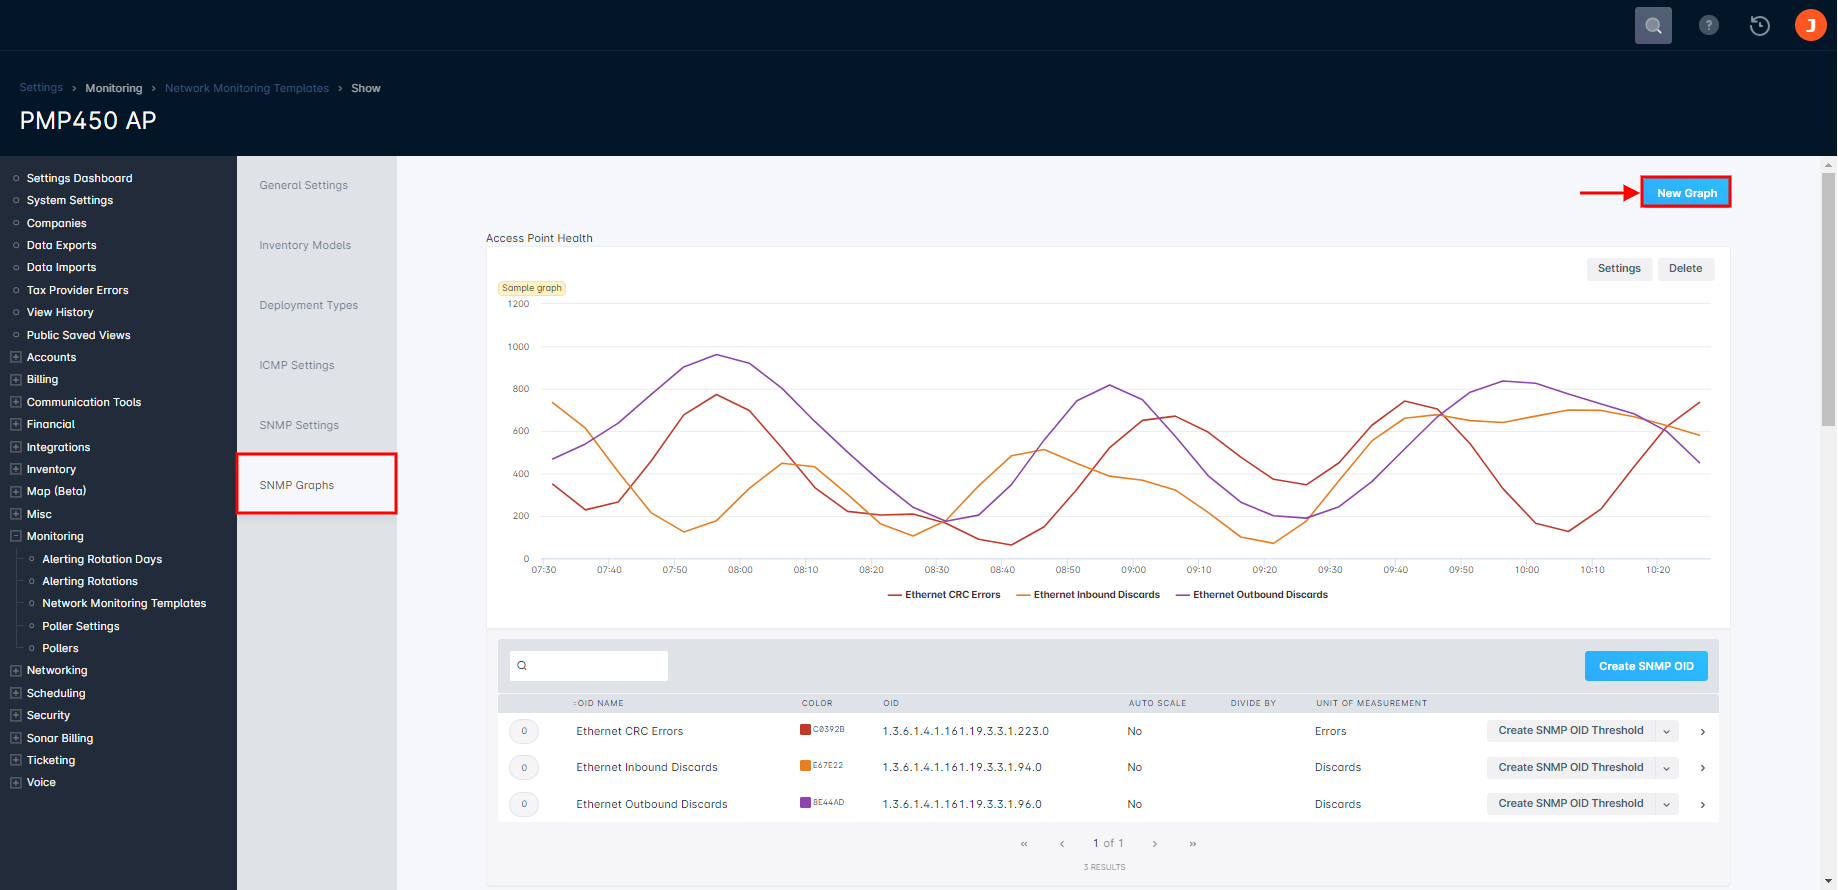
Creating a SNMP graph
When you create a SNMP graph, you can specify one or multiple OIDs to be graphed. Generally, it is recommended to input and graph OIDs that match a certain criteria (e.g., rate, power, etc.)
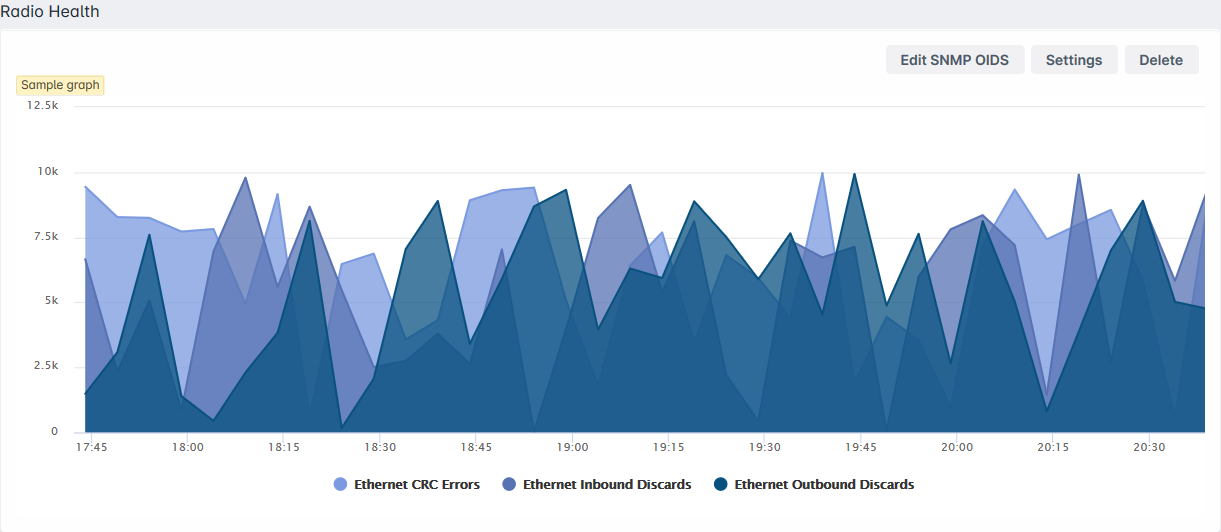
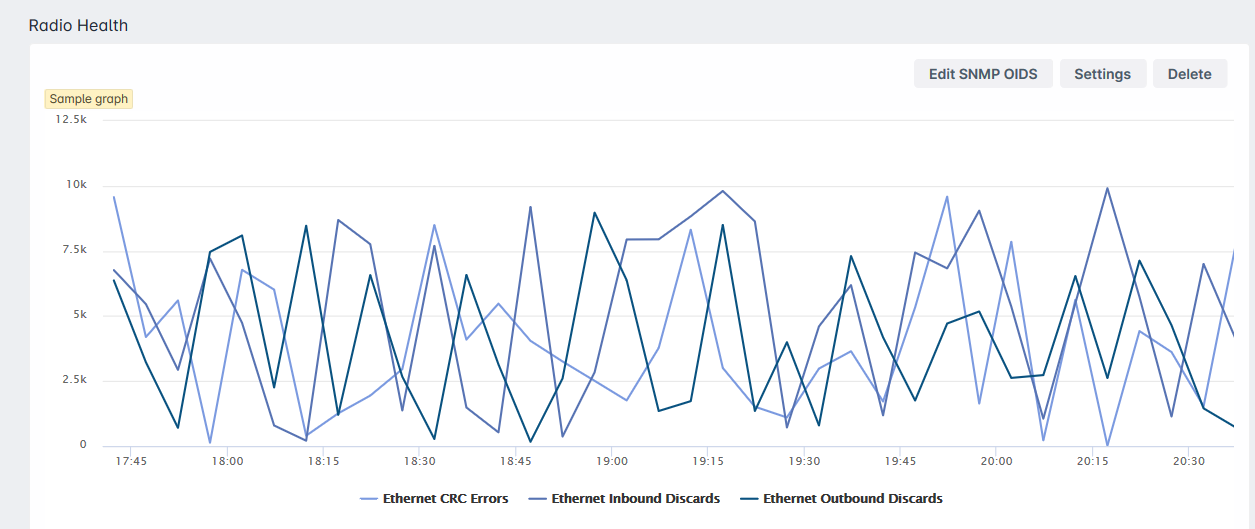
When you create a graph, you are given three options on how the graph will be displayed.
Area Graph:
Bar Graph:
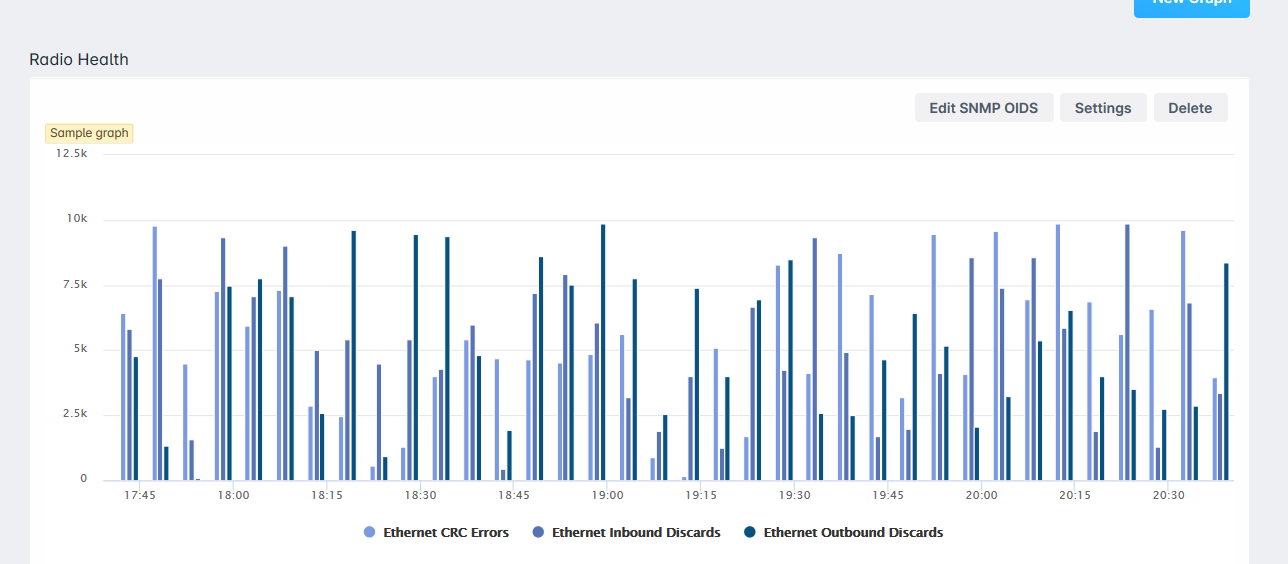
Line Graph:
Customizing your graphs
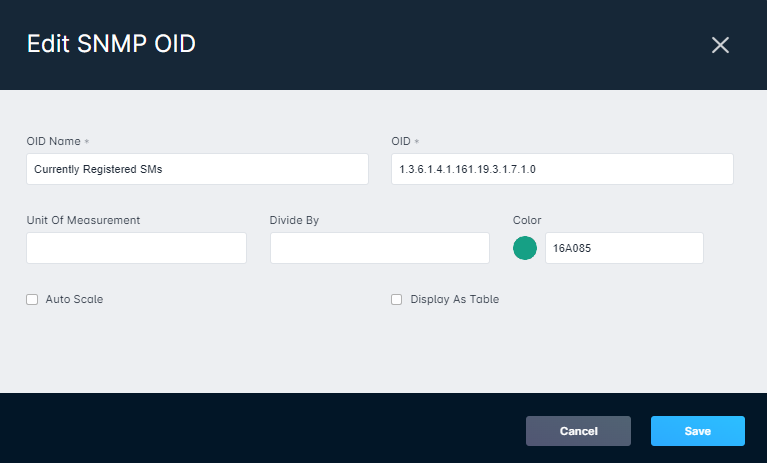
Once you have the correct OID, back in Sonar Monitoring Graphs, click on Edit SNMP OID. Then, type a SNMP OID name and OID copied from the Ireasoning MIB browser. In here you can specify if you want the info to be displayed as a table rather than a graph, and specify if there is a unit of measurement (for example download or upload speed kb/s). If you wanted this info to convert to something else, you can define the unit of measurement and what number to divide it by. Lastly, you will choose what color the graph will be displayed.
Viewing your SNMP / ICMP Results
Once you've configured a Monitoring Template and a Poller, the results will be viewable via a few different locations:
- From Inventory > Inventory Items and by clicking on the arrow relating to the selected line item. This will populate a sidebar reflecting historical graphs of the ICMP and SNMP information.
- From Network > Dashboard and by clicking on the arrow relating to the selected line item. This will also populate a sidebar reflecting historical graphs of the ICMP and SNMP information.
- When viewing a customer's account, navigate to Network & Inventory > Inventory Items and click on the arrow relating to the inventory item you wish to view further. Once again, this will populate the same sidebar as the other two methods.
- Each serviceable address has access to this information too by selecting Inventory Items on the management overview page and opening the same sidebar from there.