Our Products & Services
Getting Started
First Time Setup
Getting Started with Inventory
Getting Started With Jobs
Getting Started with Accounts
Getting Started with Ticketing
Setting Sonar up for Billing
Baseline Configuration
How To: Using Sonar's Customer Portal
User Specific Resources
Accounts
Account Groups: Overview & Example Use Cases
Account List View: Overview
Account Management View: Overview
Account Overview Customization
Account Statuses: Overview & Example Use Cases
Account Types: Overview & Example Use Cases
Anchor & Linked Serviceable Addresses: Overview and Best Practices
Archiving an Account: Overview
CPUC Fixed Broadband Deployment by Address
Child Accounts: Best Practices & How Tos
Creating a New Account
Direct Messages: Overview
Disconnecting an Account
Disconnection Reason Management: Overview
Exploring Task Groups
FCC Broadband Data Collection (BDC) Filings: How Sonar Can Help
FCC Data Exports: General Overview and Usage
Future Serviceable Addresses: Overview
Lead Intake Form Processing
Notes: Best Practices & Use Cases
Scheduled Events: Overview & Use Cases
Serviceable Addresses: Overview and Usage
Specify Account ID upon Creation
Tasks & Task Templates: Overview
Using Sonar's FCC Broadband Label Generation Tool
Billing
ACH Batching: Overview
Accounts in Vacation Mode
Avalara: Overview & Setup
Batch Payments & Deposit Slips: Overview
Billing Calculator
Billing Defaults
Billing Settings
Building Packages
Building a Data Service
Canadian ACH tool
Changing Service Pricing in Sonar: Best Practices
Configure Service Eligibility Criteria: Overview
Considerations When Using Avalara with Voice Services
Creating Discounts for Services and Packages
Delinquency Billing Best Practices
Delinquency Exclusions: Overview
Dual Data Services: Overview
Email Invoice Batch: Overview
General Ledger Codes: Overview
General Transactions: Best Practices
How Sonar Prorates Billing
How to Take Bank Account Payments
How to Use SKUs: Overview
How to: Adding a Service to an Account
Invoice Templates: Overview
Leveraging PayPal as a Payment Method in Sonar
Manual Transactions
Multi-Month Billing & Multi-Month Services
Print to Mail
Printed Invoice Batches: Overview
Reversals and Refunds: Overview
Services: Overview
Setting Up Payment Methods and Taking Payments
Setting up Bank Account & Credit Card Processors
Taxes Setup
Usage Based Billing Policies: Overview and Usage
Usage Based Billing Policy Free Periods: Overview and Usage
Using Tax Exemptions - How To
Communication
Communications: Call Logs Overview & Best Practices
Communications: Messages Overview
Email Variables & Conditions
Message Categories: Overview & Use Cases
Phone Number Types: Overview and Use Cases
Saved Messages: Overview
Setting up an Outbound Email Domain
Trigger Explanations
Triggered Messages: Setup
Using Outbound SMS
Using the Mass Message Tool
Companies
How to: Setting Up a Company in Sonar
Managing Multiple Companies in Sonar: Best Practices
Rebranding your Sonar Instance
Field Tech App
Financial
Agreement Templates
Invoice Attachment Use Cases & PDF Examples
Invoice Messages: Overview & Use Cases
Invoices in Sonar: Examples, Creation & Contents
Integrations
Atlas Digital CORE Integration
Calix Cloud Data Field Mappings
Calix SMx Integration: Overview
CrowdFiber Integration
External Marketing Providers
GPS Tracking Providers: Overview
GoCardless Integration: Overview & Setup
Handling Static IPs with the Calix SMx Integration
How to Connect Cambium to your Sonar Instance
How to Connect Preseem to your Sonar System
How to: Using Webhooks in Sonar
Integrating with Calix Cloud
RemoteWinBox - Integration with Sonar
Sonar Retain: AI-Powered Customer Retention & Quality Intelligence
Tower Coverage Integration: Overview
VETRO FiberMap V2 Integration: Overview
VETRO FiberMap V3 Integration: Overview
Webhook Events: Overview
Webhooks in Sonar: Basic PHP Example
iCalendar Integration
Inventory
Inventory List View: Overview
Inventory Model Management: General Overview
Network Inventory: How-to & Usage Guide
Segmentable Inventory: How-to & Usage Guide
Setup of Inventory: Manufacturers, Categories, and Assignees
Tracking and Using Consumable Inventory
Jobs
Applying Task Templates to Jobs
Edit Job Options
Example Jobs & Templates
Geofences: Overview
Job Types: Best Practices
Jobs and Scheduling: Overview
Scheduling Dispatcher View: Overview
Scheduling How-to: Creating and Booking a Job
Scheduling Table View: Overview
Scheduling Week View: Overview
Setting Up Schedules General Overview
Mapping
Misc.
Combining Custom Fields & Task Templates for Information Storage
Custom Fields Overview & Use Cases
Custom Links: Overview
Task Templates Overview & Use Cases
Monitoring
Building Alerting Rotations
Building a Monitoring Template
Poller Troubleshooting
Pollers: General Overview, Deployment Strategy, Build Out & Setup
Networking
Adtran Mosaic Cloud Platform Integration: Overview
Assigning RADIUS Addresses
Assigning an IP Address Using Sonar's IPAM: How to
Automating IP Assignments, Data Rates, and Network Access in Sonar
Building Address Lists
Building RADIUS Groups
Building a Device Mapper
Cable Modem Provisioning
Controlling Customer Speeds with Sonar: General Overview
DHCP Delivery
Data Usage Available Methods
Finding your OIDs
FreeRADIUS 3: Build-Out & Integration
How Sonar Communicates - Egress IPs Explained
IP Assignments & Sonar
IPAM: Basic Setup
IPAM: Overview
LTE Integration
MikroTik as an Inline Device: Integration With Sonar
MikroTik: Controlling Access
MikroTik: Controlling Speeds
MikroTik: Setting Up a Sonar Controlled DHCP Server
Netflow On-Premise Integration: Setup and Overview
Network Dashboard: Overview
Network Sites: Management View Overview
PacketLogic: Integration With Sonar
Pulse, Polling, and PHP
RADIUS: Build-Out & Integration with Sonar
RADIUS: Building Reply Attributes
Setting Up CoA Proxy
Sonar Flow
Sonar IP Addressing
Using Multiple Network Devices in Sonar
Purchase Orders
Release Notes
Reporting
Common Custom Report Uses
Enhanced Business Intelligence - Tips & Tricks for Advanced Users
How To Enhance Your Reporting With Custom Field Data
How to Unpublish a Report or Dashboard
Managing Scheduled Reports
Report Licenses
Reporting Time Zone Behavior
Sonar's Business Intelligence: Overview
Understanding Sonar Reports
Using Sonar DataConnect to Connect BI Applications with Your Sonar Instance
Security
Application Firewall: General Overview and Best Practices
Auth0: Overview
Multi-Factor Authentication: Overview
Password Policy In Depth
Removing a Terminated Employee In Sonar
Role Creation using GraphiQL
User Role Creation & Best Practices
Users: Overview
Sonar Billing
sonarPay
How to Find Your Processing Rates in the sonarPay Portal
Reconciling sonarPay Disbursements with Bank Deposits
What to Expect After sonarPay Enrollment
sonarPay Canada Disbursements: Overview
sonarPay Chargebacks & Disputes: Overview
sonarPay Disbursements: Overview
sonarPay Migration: Approving Your Match & Going Live
sonarPay Migration: The Token Transfer & Matching Process
sonarPay Monthly Statement: Overview
sonarPay Overview
sonarPay Reversals, Voids, & Refunds: Overview
sonarPay: Token Migration Process
System
A Deeper Dive into the New Sonar API
API Calls Using Third Party Applications: Personal Access Tokens
Browser Compatibility and Minimum Hardware Requirements for Sonar
Consuming the Sonar API
Controlling Your Landing Page: Personal Preferences
Customizing Your Customer Portal
Date/Time Picker: Overview
Dynamic Time Zones in Sonar
Filtering: Overview
Frequently Used Terms
Getting Your Data into Sonar
GraphQL Rate Limiting Overview
How To Use GraphiQL to Understand the Sonar API
How Your Data is Backed Up
How to Best Use Global Search
Interacting with Files via the API
Introducing the New Sidebar
Main Menu: Overview
Mutations in the Sonar API
Notification Preferences
REST API Wrappers for V1 Compatibility
SMS Notifications
Sonar's Rich Text Editor
System Settings: Overview
The New Sonar API
Troubleshooting the Customer Portal
Upgrading your Ubuntu OS - Customer Portal Upgrades
User Profile: Your Personal User Settings
View History & All Logs: Overview
Ticketing
Advanced Ticketing Features
Canned Replies Examples & Templates
Canned Reply Categories
Exploring Ticket Groups
How Sonar Manages Spam Tickets
How to Integrate Inbound Mailboxes with Slack
Inbound Mailboxes Example Build
Ticket Category Families & Ticket Categories: Overview
Ticket Resolution Reasons: Overview
Ticketing: Overview
Using Parent Tickets
Voice
API Changes for Voice Billing
Best Practices to Remain CPNI Compliant
Billing Voice Services in Sonar
Deploying Voice Services in Sonar
Working With the Sonar Team & Additional Resources
Sonar's Security Practices & Certifications
Security & Compliance
Sonar and General Data Protection Regulation (GDPR)
Technical Security Overview
Best Practices for Fast Tracking a Support Request
Feedback Portal / Suggest a Feature
Learning with Sonar: Tools and Resources
New Client Training Overview
Sonar Casts Table of Contents
Submitting Bugs vs. Feature Requests
The Sonar Community Forum
The Sonar Status Page
Third Party Customer Support Referrals
Where Sonar Stores Your Data
Table of Contents
- All Categories
- Reporting
- How To Enhance Your Reporting With Custom Field Data
How To Enhance Your Reporting With Custom Field Data
 Updated
by Mitchell Ivany
Updated
by Mitchell Ivany
Read Time: 4 mins
Custom Fields let you store unique data on different items in your Sonar instance—but pulling that data together can be tricky. Instead of opening each account to see what’s been entered, you can use Sonar’s Business Intelligence Reporting to build a custom report that displays the values stored in Custom Fields for a selected entity.
Creating the Report
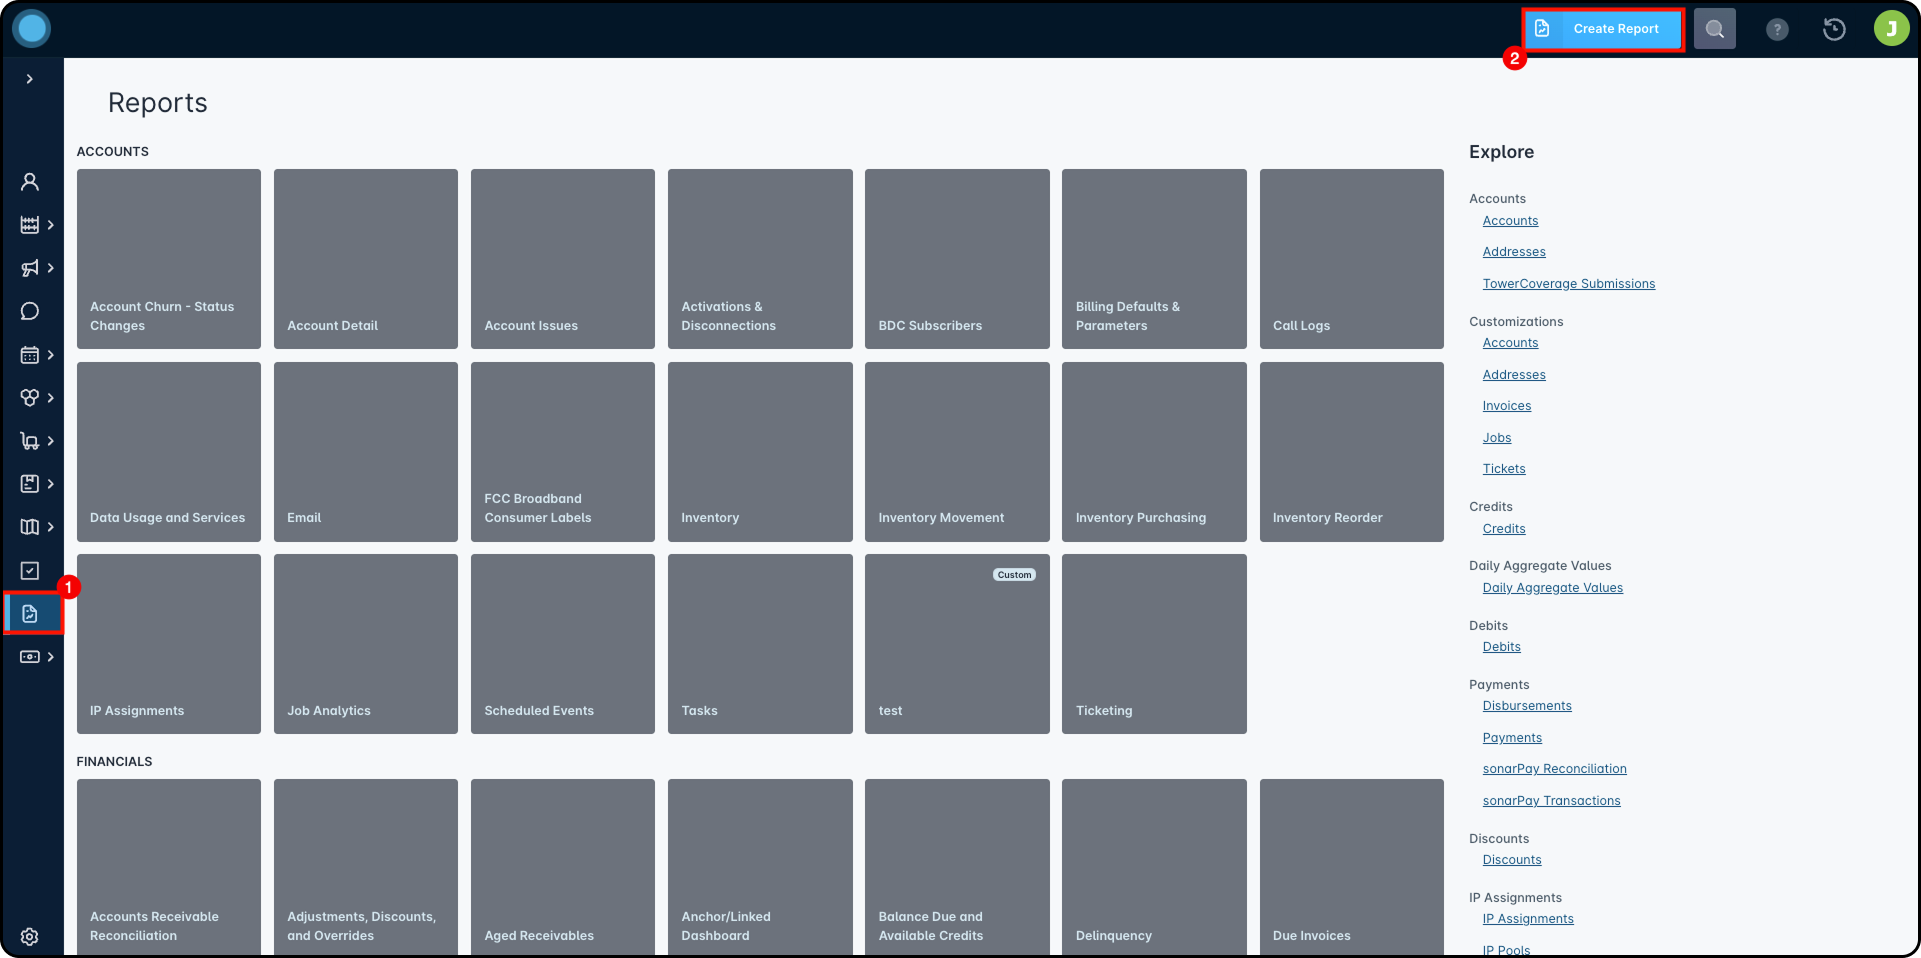
To get started, go to the Reports dashboard and click Create Report.
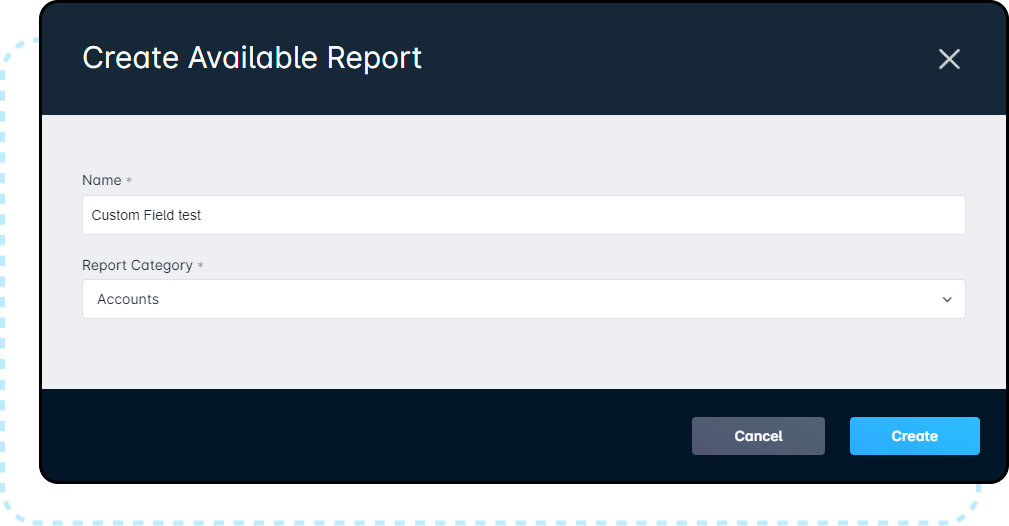
In the creation window, enter a report name and choose a report category.
For this example, we’ll create a report named “Custom Field test” in the Accounts category.
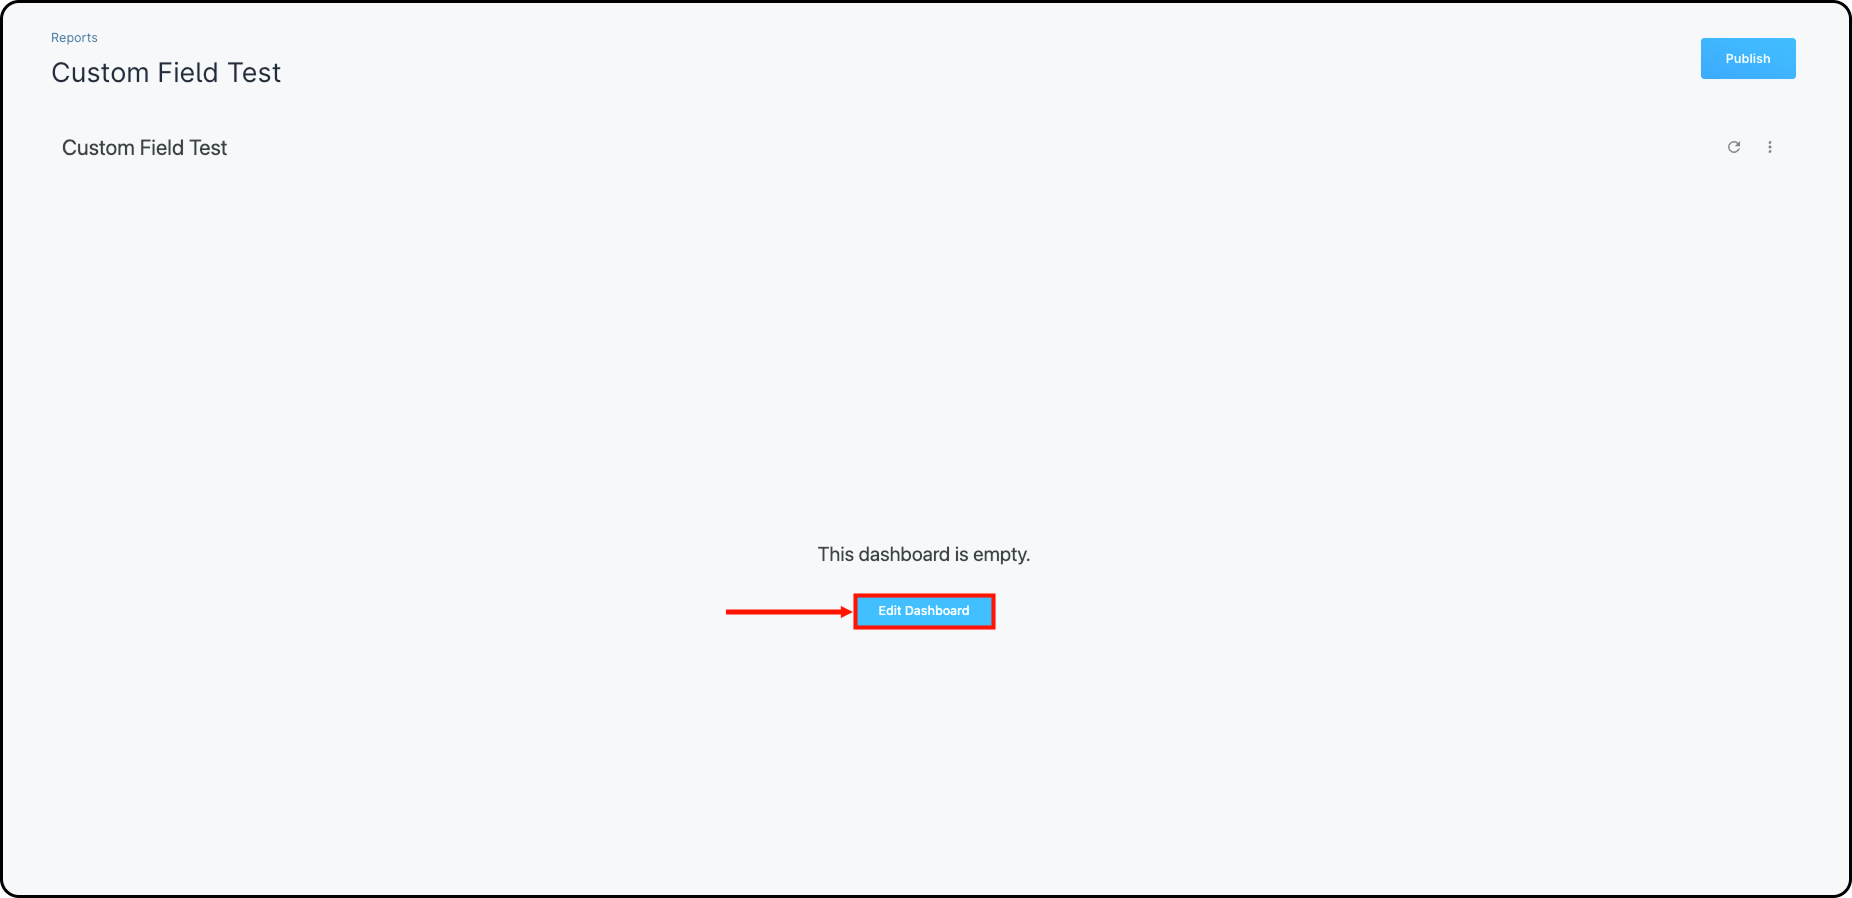
Configuring the Dashboard
After you create the report, you’ll land on its dashboard. This is where you choose which data shows in the report.
- Click Edit Dashboard.
- When the edit bar appears, click Add → Visualization.
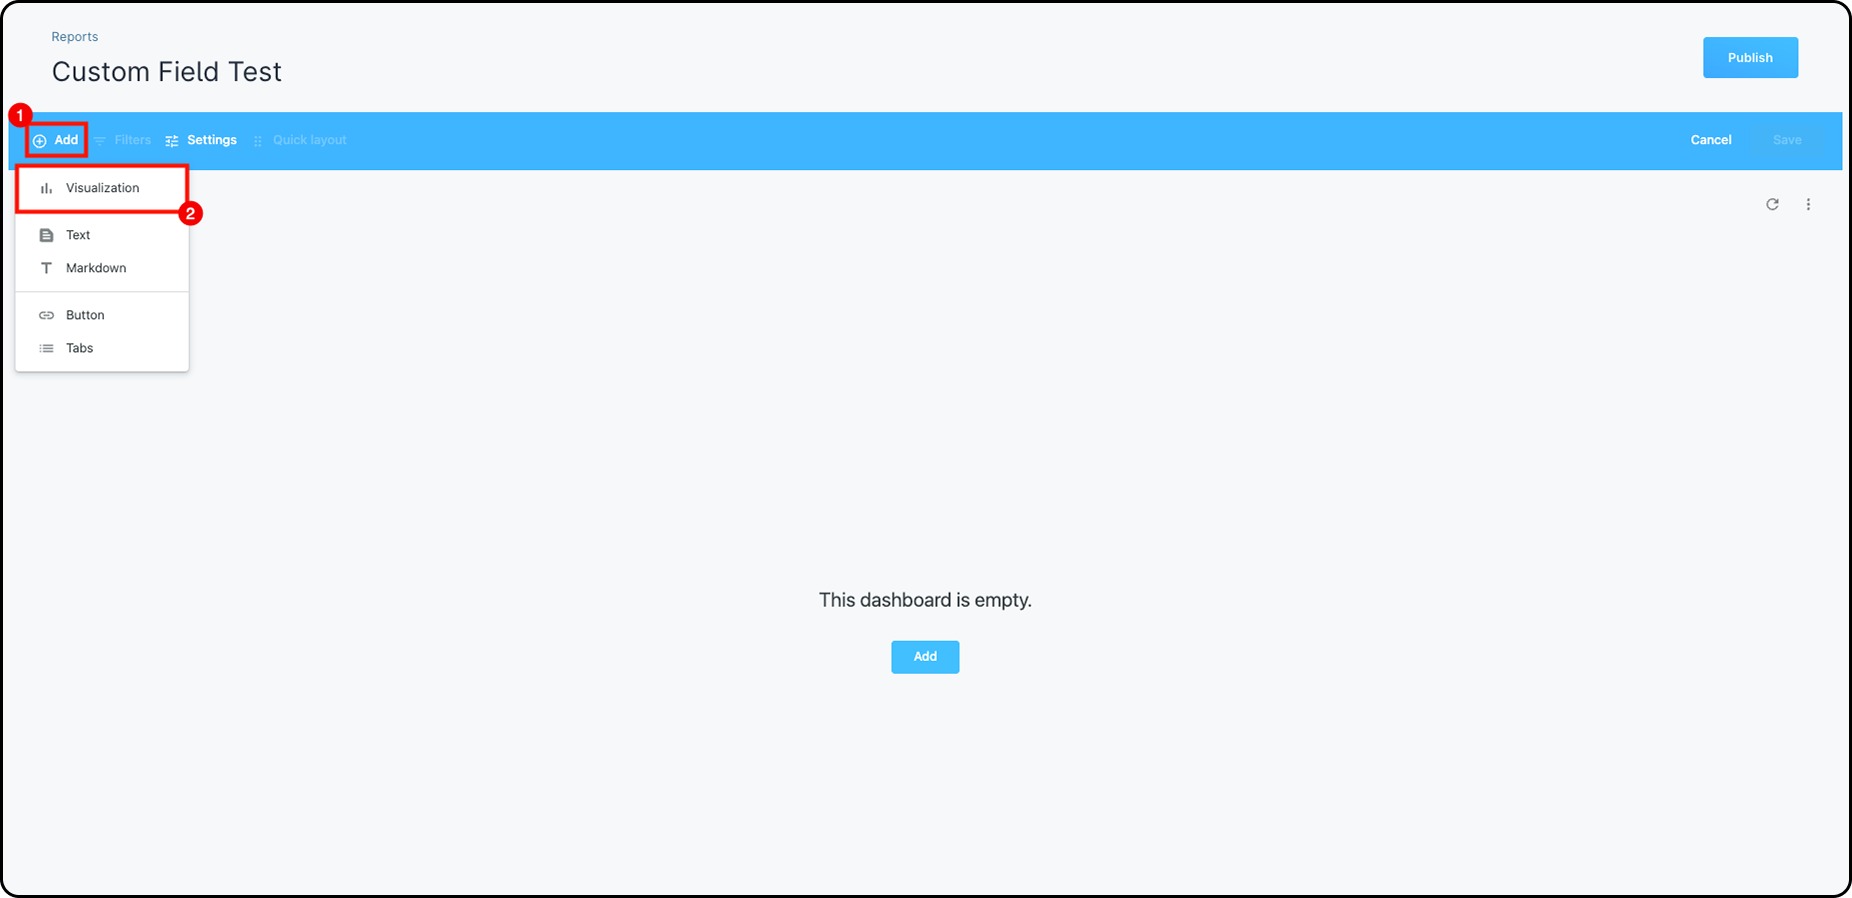
- In the Explore window, pick the explore group that fits your report. For this example, choose Accounts.
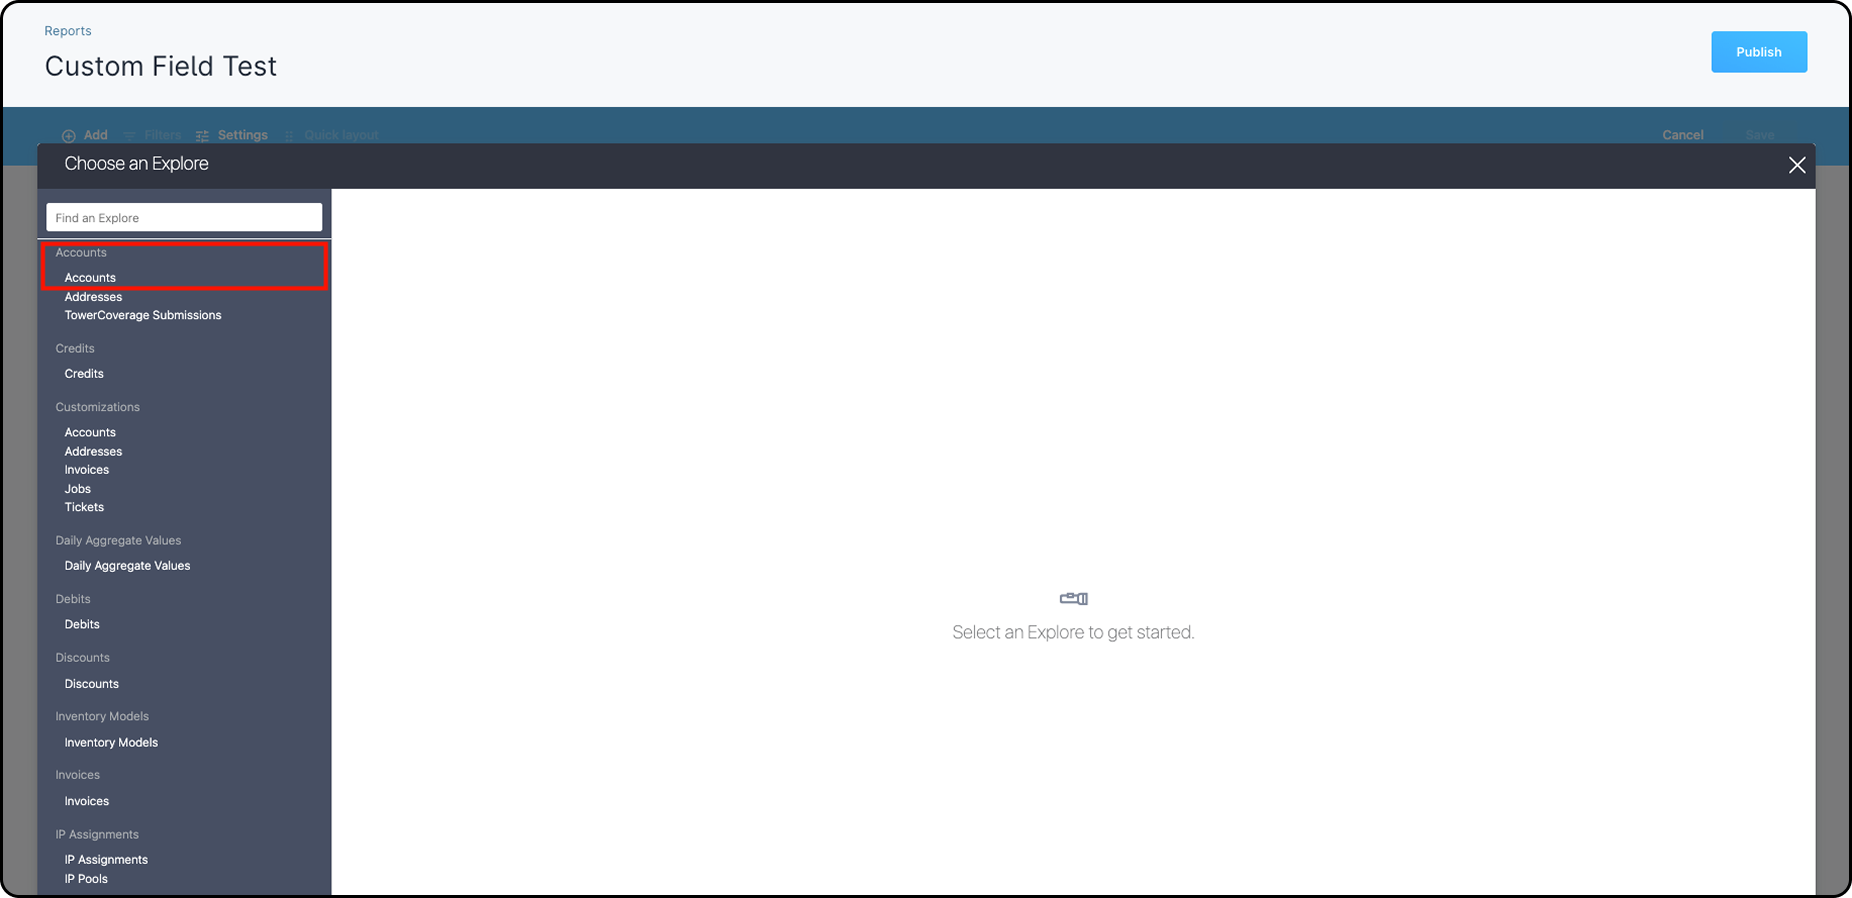
Custom Field data tables (Accounts)
Within Accounts, you’ll see several options for Custom Field reporting:
- CustomFieldData: This is the default Custom Field Data data table. Pulls basic Custom Field details (value, field ID, type, created date, last updated).
- CustomFieldData > CustomFields: Pulls details about the Custom Field itself (name, required status, and more).
- CustomFieldDataX (X being a number 1 through 5): Similar to CustomFieldData, but includes a built-in filter so you can run multiple Custom Field queries side by side in one table.
Example 1: report using only CustomFieldData
In this example, we’ll build a table using two data tables:
- Accounts (to show the account ID and account name).
- CustomFieldData (to show values stored in Custom Fields), filtered to only include accounts where a Custom Field has a value.
This report will return every account and every Custom Field that has data. That can work for smaller setups, but as you add more accounts and Custom Fields, the results get crowded—especially when all values land in one column.
You can add the Custom Field Name from CustomFieldData > CustomFields, but large datasets can still be hard to filter and compare. That’s where CustomFieldData1–CustomFieldData5 are useful.
Example 2: report using CustomFieldData1–CustomFieldData5
In this example, we’ll build a new tile using multiple numbered CustomFieldData tables. Each one uses the Custom Field ID Input (filter-only) field to pull a specific Custom Field, and you can rename each column to match the Custom Field it represents.
The result is a table that shows all accounts alongside separate columns for each Custom Field value. While this example focuses on Account Custom Fields, the same approach works for other entities that support Custom Fields (like Addresses or Jobs).
While CustomFieldData1–CustomFieldData5 make it easier to view multiple Custom Fields as separate columns, that layout also makes filtering harder. Because each Custom Field value lives in its own column, there isn’t a single “has Custom Field data” field you can reliably filter on to remove accounts with no values. If you need to exclude accounts with no Custom Field data, export the report and apply the filter in your preferred spreadsheet tool.
This column-by-column setup makes it easier to report on specific business metrics, like ad performance, referrals, and customer health scores.
Most users expect to add a Custom Field like Sales Agent as a column and still see all accounts—even ones with a blank Sales Agent.
That’s why the filter-only input field exists: it lets you pick the Custom Field you want to display without filtering out accounts that don’t have a value.