One of the many issues that can occur when configuring the poller is a failure of the device or Virtual Machine you've configured to poll your network reporting the data back to your Sonar instance. This can result in all devices showing as "good" when observed on the Network panel, even if they've never been contacted. If you suspect your Poller isn't communicating with Sonar, you can review the following troubleshooting guidelines:
In the Poller GUI, check the API key and the link to the Sonar instance to make sure both are correct.
Your Poller may be polling too many devices simultaneously or polling your devices too frequently. You can uncheck some of the subnets on the Monitoring Template to see if it makes a difference, and if so, deploy additional pollers. You may also need to increase the "Account Polling" setting within your instance, under Settings > Monitoring > Poller Settings.
Your Poller hardware may be running out of disk space. Running the command below will tell you how your disk usage is doing as well as which top 3 poller directories are taking up a lot of space.
# See how much used/available disk space you have:
df -h /

# See which poller-related directories are large:
du --exclude=vendor -h /usr/share/sonar_poller | sort -hr | head -3
Why is my Poller not polling my inventory item(s)?
If you're experiencing issues with the Poller returning results for specific Inventory Items, then there are some alternative troubleshooting steps to explore. For the purpose of these troubleshooting guidelines, we'll assume the Poller hardware is connected to the network without issue, is running a default configuration, and communicating with Sonar properly. From this point, it becomes an exercise to ensure your inventory items and monitoring templates are correctly configured.
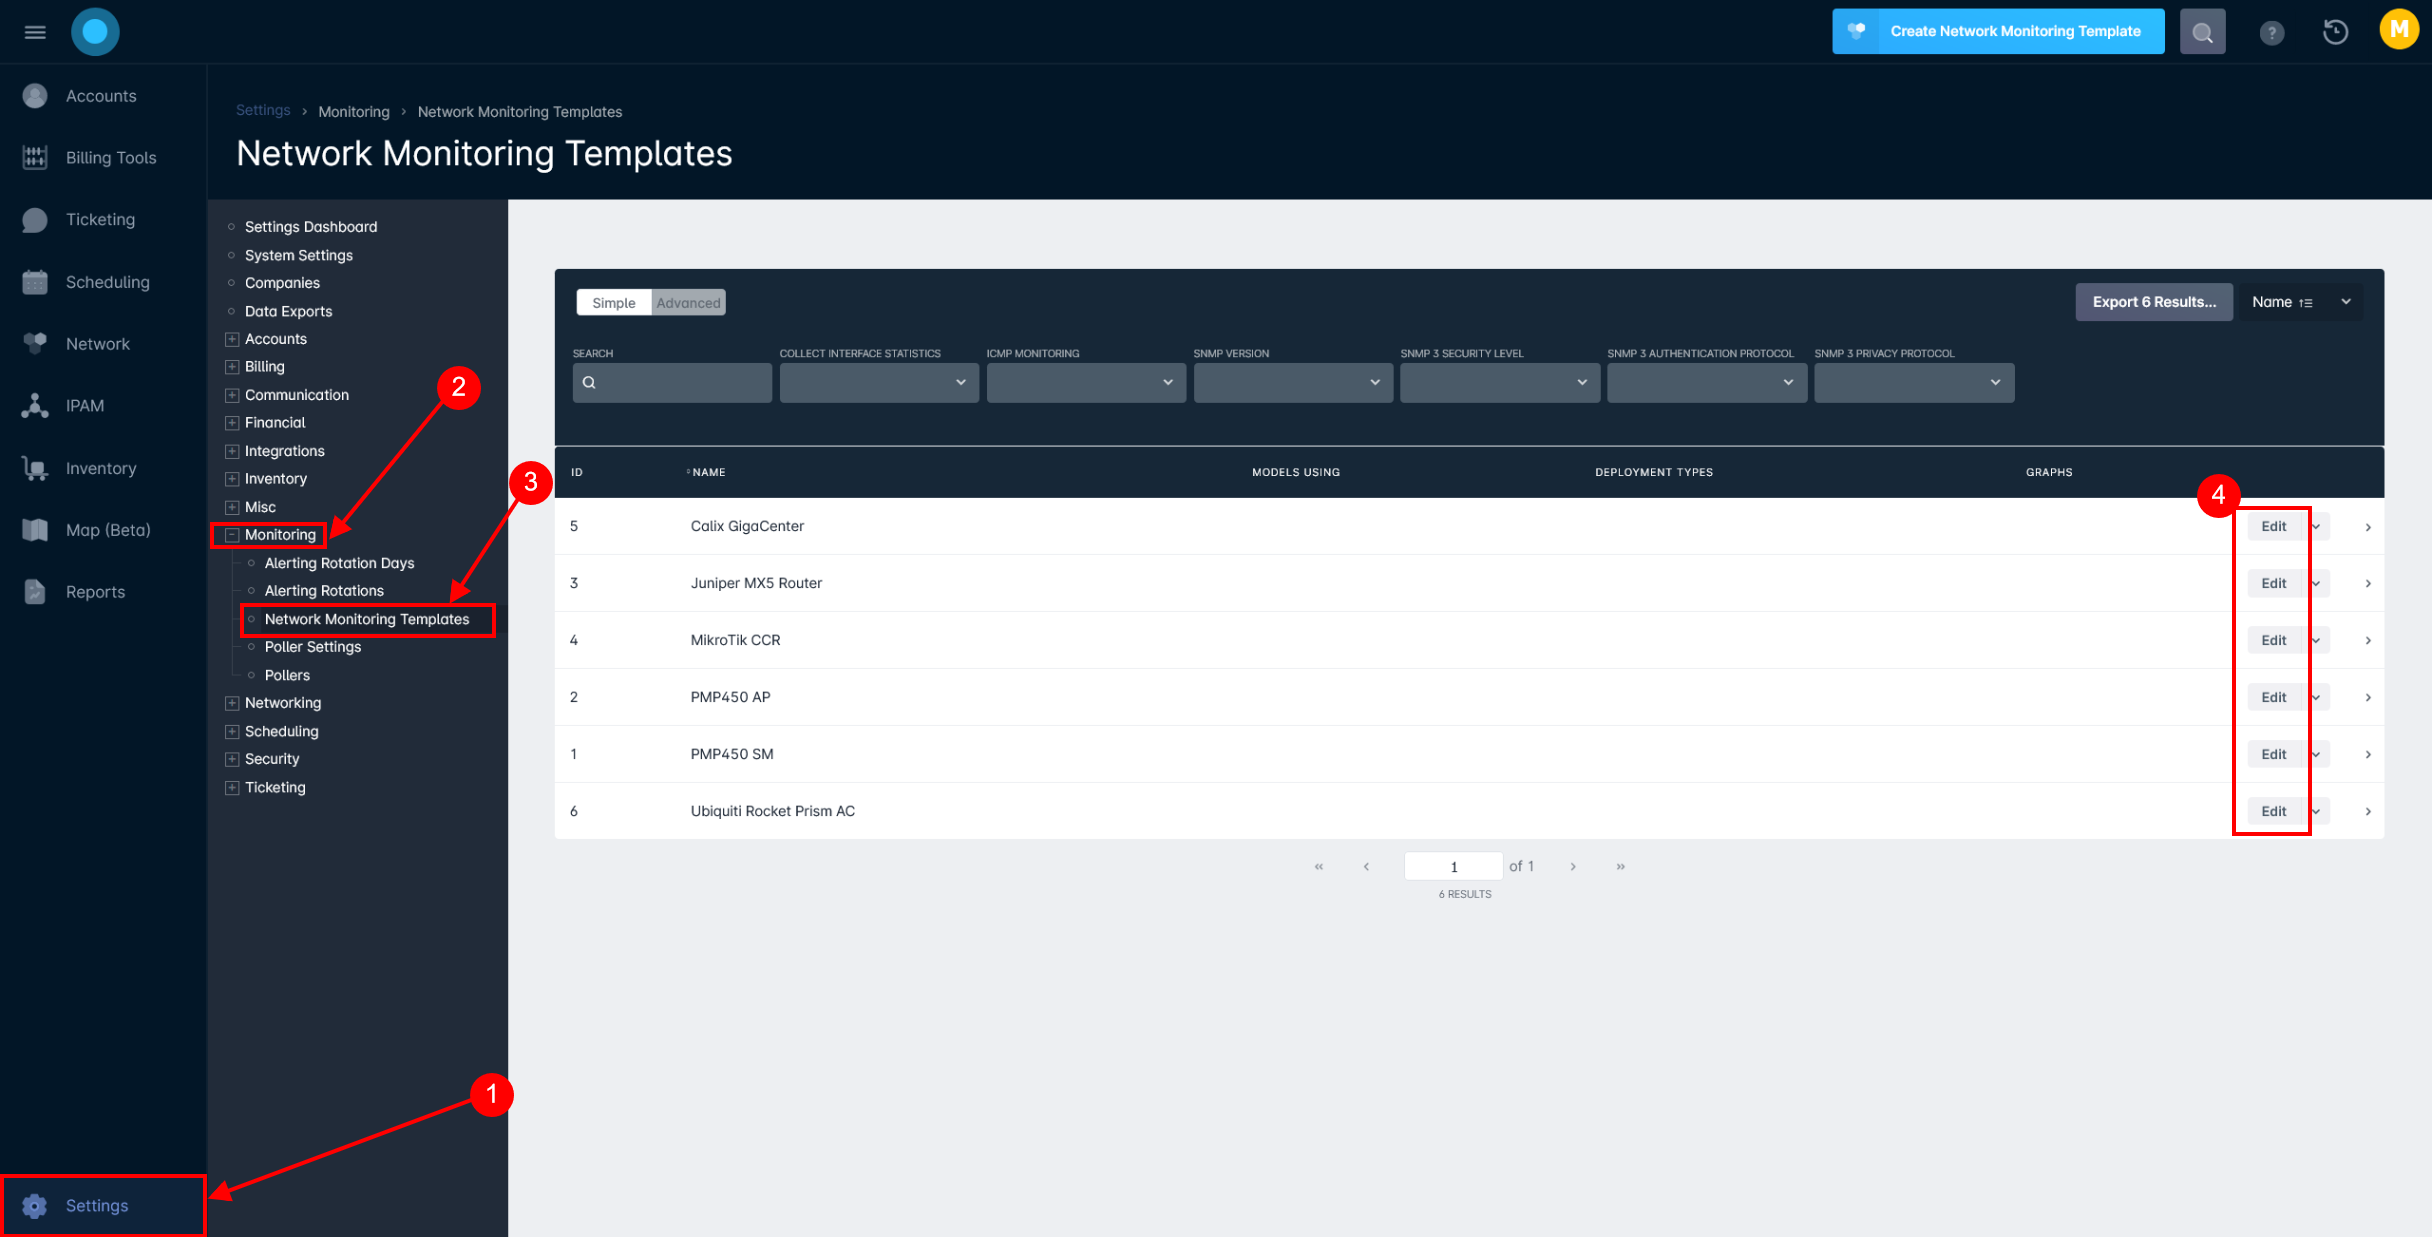
There may be an issue with the monitoring template you've configured within your instance. To check the configuration settings, go to Settings > Monitoring > Network Monitoring Templates and edit the template responsible for the inventory item(s) not being polled:Ensure that:
You have a template,
You have added the Inventory Model you want to monitor to the template,
The template is configured to monitor ICMP and/or SNMP
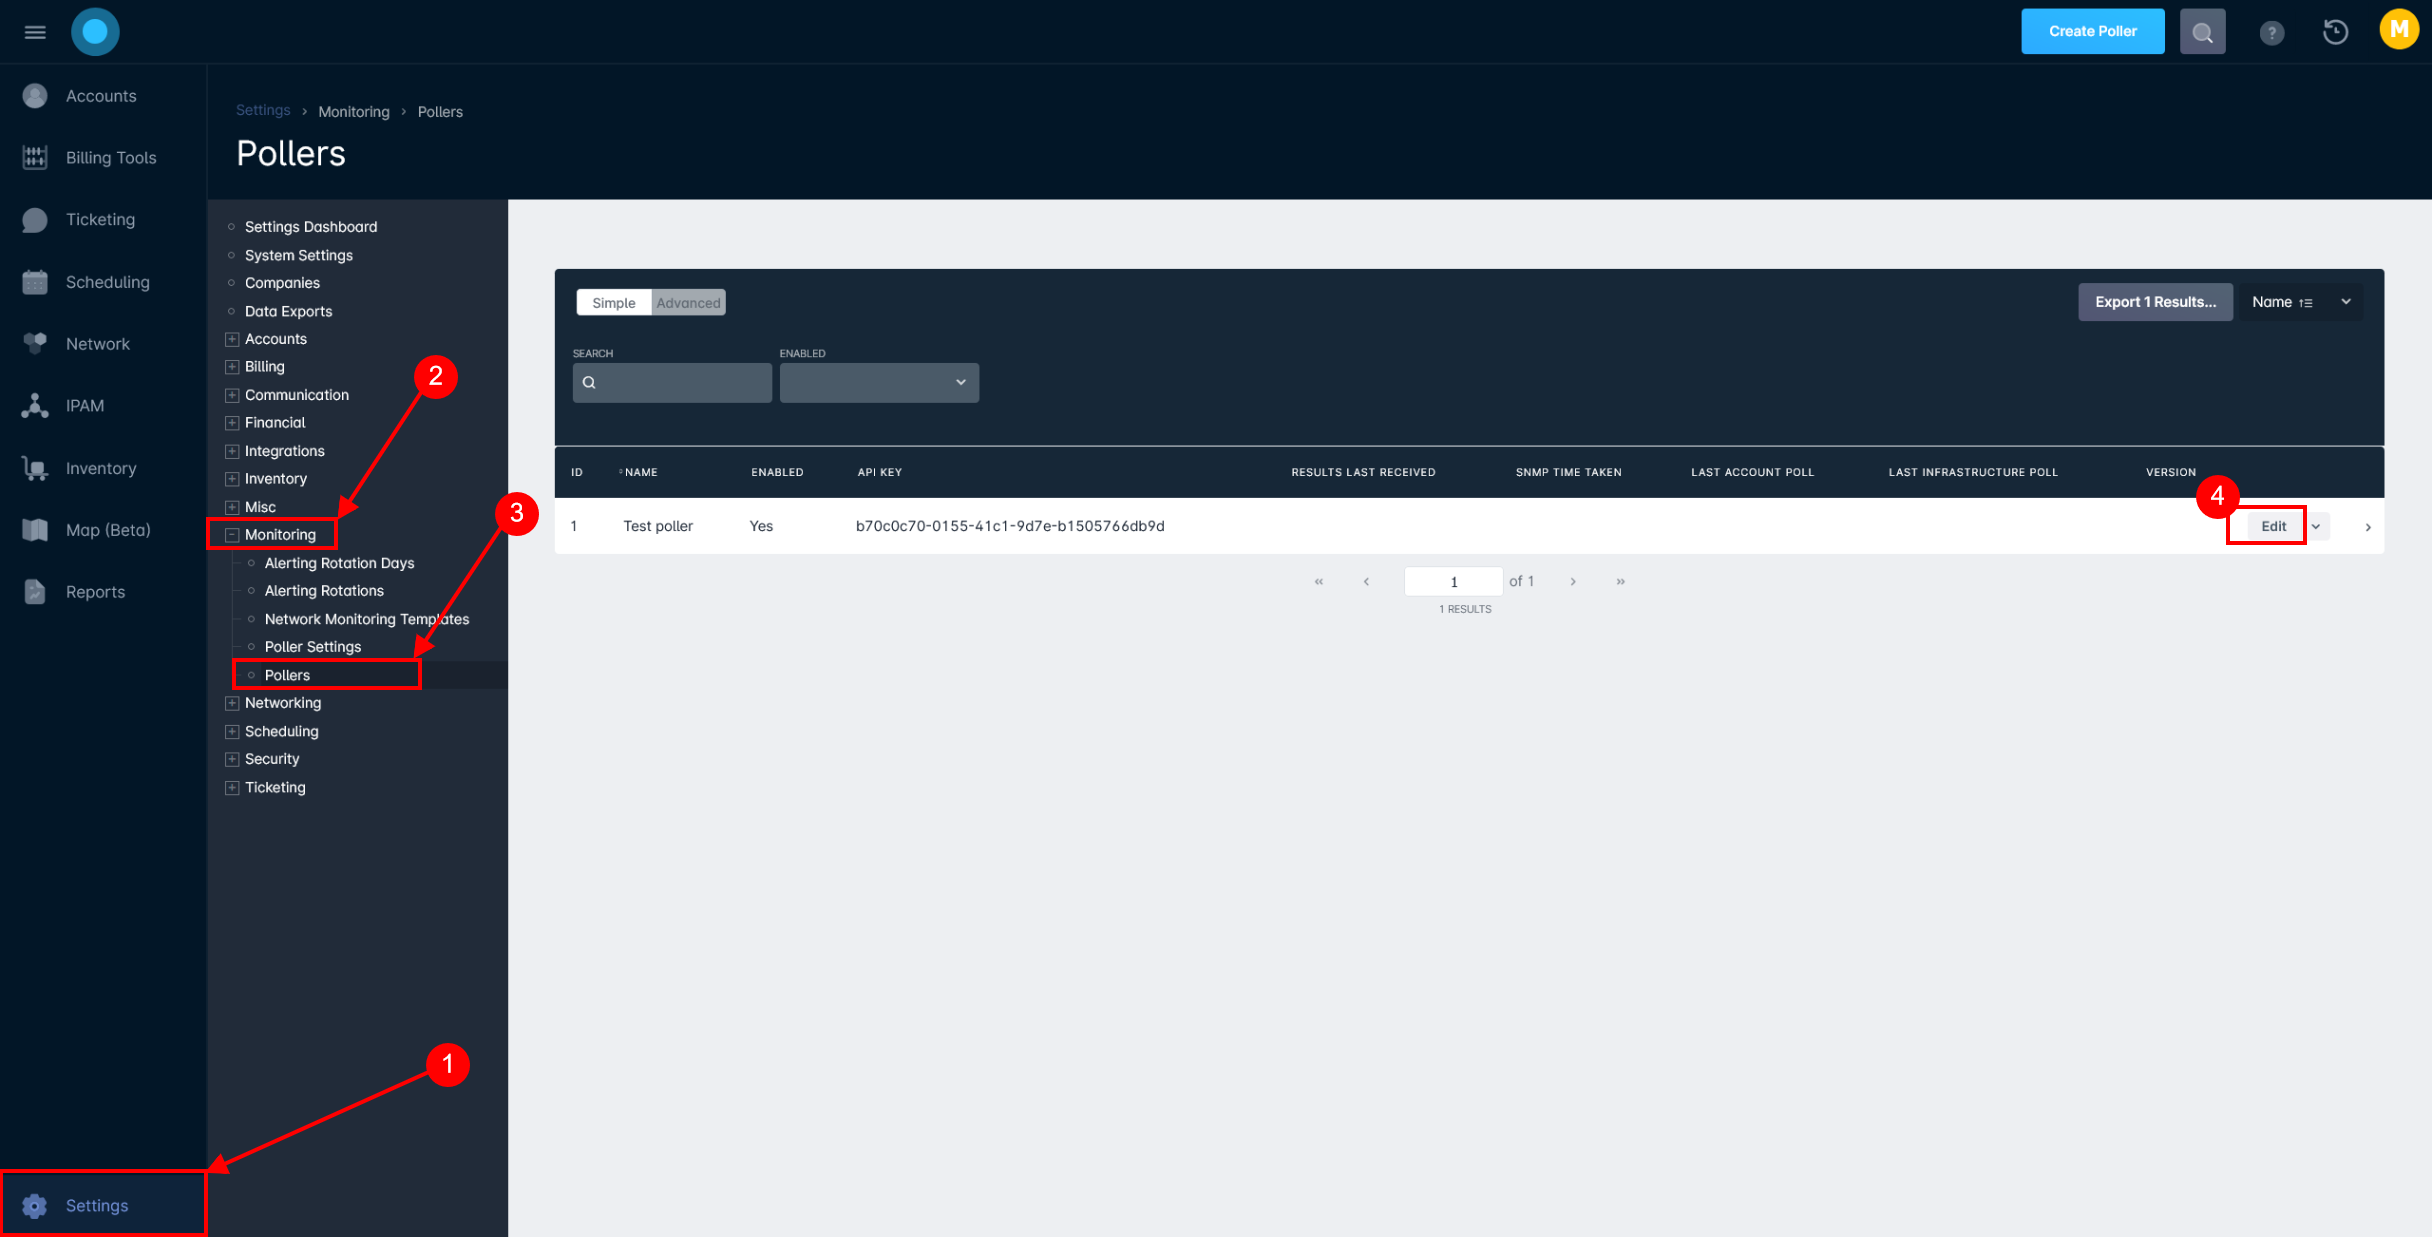
There may be an issue with how the Poller is configured within your Sonar instance. Navigate to Settings > Monitoring > Pollers and verify the configuration of your Poller by clicking the "Edit" button:Ensure that the Poller you have configured is set to monitor the subnet that you expect it to. Verify by clicking the "Edit" and ensuring that the subnet in question is checked.
If no Poller details are shown, as depicted in the screenshot example, it's because your Poller has never contacted your Sonar instance. In this case, refer to the previous section for troubleshooting.
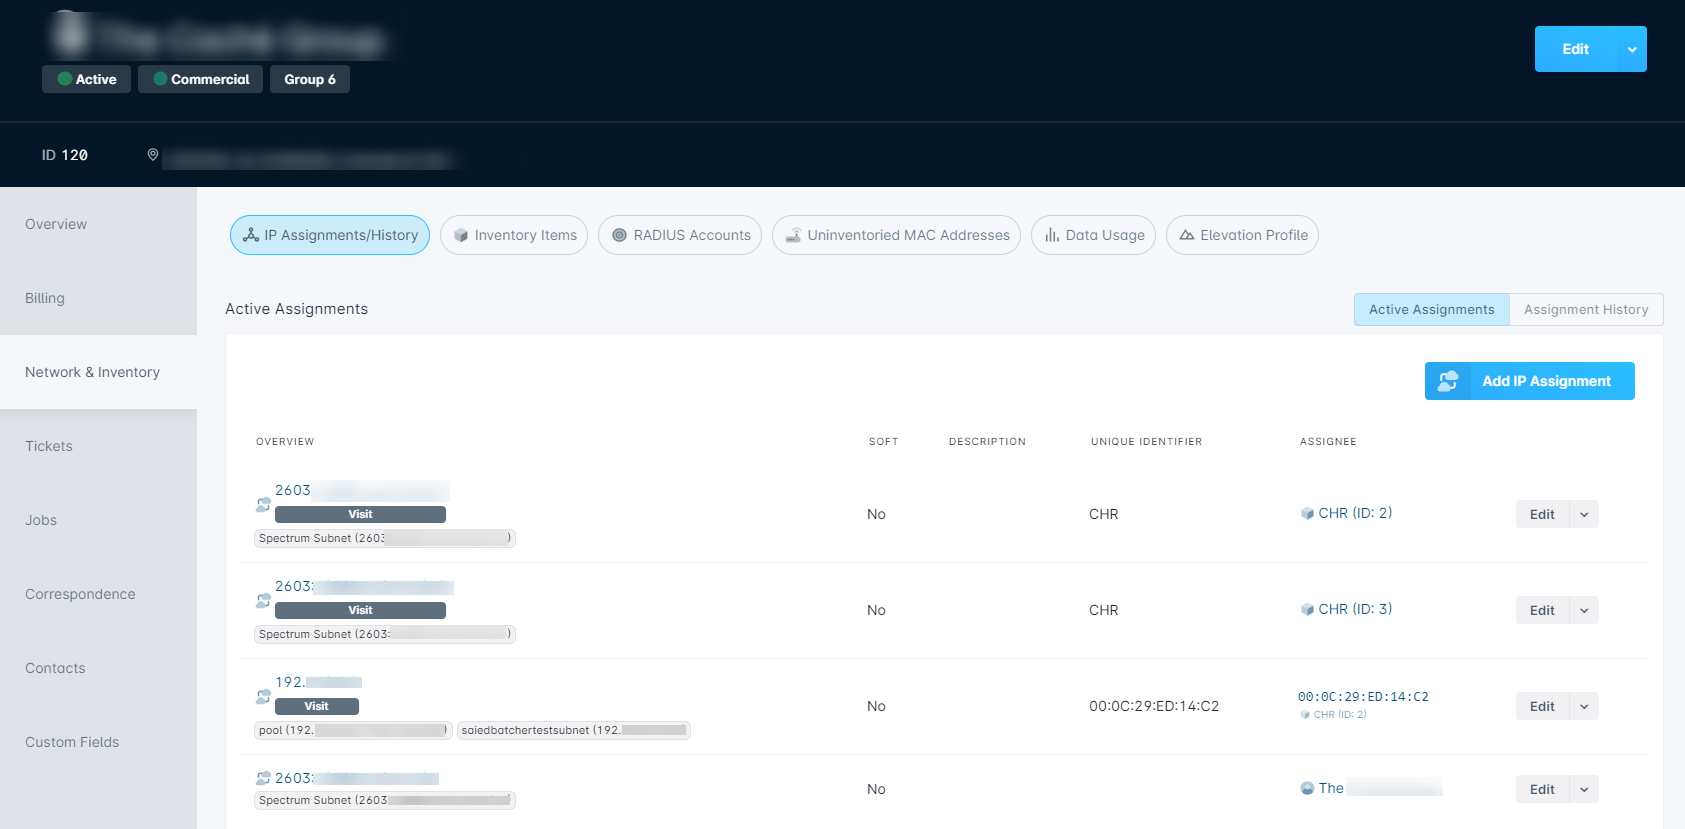
The lack of reporting for your Inventory Item may be due to how the IP Address is assigned. If the IP Address isn't assigned to the MAC Address, IMSI Field, or the Inventory Item itself, the IP address won't be polled. Applying the IP Address to an entity, such as Network Site or Account, will not work. The IP must be assigned to the item in some way, which can then be assigned to the entity.
In the image below, IP addresses 1, 2, and 3 in the list will be monitored, because the assignee column shows that 1 and 2 are assigned directly to an item, and 3 is assigned to an item’s MAC address. The bottom address, however, is assigned directly to the account, so it will not be monitored.
Open the Poller’s web interface at https://<poller-ip> and click the Logs button at the top and see if anything indicates what might be wrong. From there, you can also enable debug logging by checking “Log all errors”
Device(s) in Sonar shown in a "Down" state when they should be "Good":
In some cases, devices in Sonar will be shown as "Down" in the Network section of your instance, but further testing will show that these devices are working just fine. In these cases, follow the troubleshooting steps below:
Check to see if the Poller is reporting that both ICMP and SNMP are down. If only SNMP is being reported as down, it is a false positive due to SNMP communication failure. In that event, proceed below.
Note that in some circumstances when using SNMPv1, an invalid OID applied to your network monitoring template will break all graphing for items that return a “no such name” response, and its SNMP status will be set to “down.”
Perform a “MIB walk” using the Net-SNMP tools on the poller to make sure the device is able to respond to SNMP walk requests. For SNMP version 1, the Sonar poller uses snmpwalk; for versions 2c and 3, snmpbulkwalk is used. You should do the same when testing.
The command format for SNMP v3 is very different. Take the values from the Sonar dropdowns under Settings > Monitoring > Network Monitoring Templates > SNMP Settings:
snmpbulkwalk -v 3 -l <security-level> -a <authentication-protocol> -A <authentication-passphrase> -x <privacy-protocol> -X <privacy-passphrase> -u <community> <inventory-item-ip-address>
For example, if your community (aka, username) is “sonar”:
snmpbulkwalk -v 3 -l authPriv -a SHA -A nowSecure1 -x AES -X nowSecure2 -u sonar 198.19.8.33
If your poller doesn't respond, make sure SNMP is enabled on the device and the community string / credentials match what is defined on the Monitoring Template.
 Updated
by Jennifer Trower
Updated
by Jennifer Trower
 If no Poller details are shown, as depicted in the screenshot example, it's because your Poller has never contacted your Sonar instance. In this case, refer to the previous section for troubleshooting.