Our Products & Services
Getting Started
First Time Setup
Getting Started with Inventory
Getting Started With Jobs
Getting Started with Accounts
Getting Started with Ticketing
Setting Sonar up for Billing
Baseline Configuration
How To: Using Sonar's Customer Portal
User Specific Resources
Accounts
Account Groups: Overview & Example Use Cases
Account List View: Overview
Account Management View: Overview
Account Overview Customization
Account Statuses: Overview & Example Use Cases
Account Types: Overview & Example Use Cases
Anchor & Linked Serviceable Addresses: Overview and Best Practices
Archiving an Account: Overview
CPUC Fixed Broadband Deployment by Address
Child Accounts: Best Practices & How Tos
Creating a New Account
Direct Messages: Overview
Disconnecting an Account
Disconnection Reason Management: Overview
Exploring Task Groups
FCC Broadband Data Collection (BDC) Filings: How Sonar Can Help
FCC Data Exports: General Overview and Usage
Future Serviceable Addresses: Overview
Lead Intake Form Processing
Notes: Best Practices & Use Cases
Scheduled Events: Overview & Use Cases
Serviceable Addresses: Overview and Usage
Specify Account ID upon Creation
Tasks & Task Templates: Overview
Using Sonar's FCC Broadband Label Generation Tool
Billing
ACH Batching: Overview
Accounts in Vacation Mode
Avalara: Overview & Setup
Batch Payments & Deposit Slips: Overview
Billing Calculator
Billing Defaults
Billing Settings
Building Packages
Building a Data Service
Canadian ACH tool
Changing Service Pricing in Sonar: Best Practices
Configure Service Eligibility Criteria: Overview
Considerations When Using Avalara with Voice Services
Creating Discounts for Services and Packages
Delinquency Billing Best Practices
Delinquency Exclusions: Overview
Dual Data Services: Overview
Email Invoice Batch: Overview
General Ledger Codes: Overview
General Transactions: Best Practices
How Sonar Prorates Billing
How to Take Bank Account Payments
How to Use SKUs: Overview
How to: Adding a Service to an Account
Invoice Templates: Overview
Leveraging PayPal as a Payment Method in Sonar
Manual Transactions
Multi-Month Billing & Multi-Month Services
Print to Mail
Printed Invoice Batches: Overview
Reversals and Refunds: Overview
Services: Overview
Setting Up Payment Methods and Taking Payments
Setting up Bank Account & Credit Card Processors
Taxes Setup
Usage Based Billing Policies: Overview and Usage
Usage Based Billing Policy Free Periods: Overview and Usage
Using Tax Exemptions - How To
Communication
Communications: Call Logs Overview & Best Practices
Communications: Messages Overview
Email Variables & Conditions
Message Categories: Overview & Use Cases
Phone Number Types: Overview and Use Cases
Saved Messages: Overview
Setting up an Outbound Email Domain
Trigger Explanations
Triggered Messages: Setup
Using Outbound SMS
Using the Mass Message Tool
Companies
How to: Setting Up a Company in Sonar
Managing Multiple Companies in Sonar: Best Practices
Rebranding your Sonar Instance
Field Tech App
Financial
Agreement Templates
Invoice Attachment Use Cases & PDF Examples
Invoice Messages: Overview & Use Cases
Invoices in Sonar: Examples, Creation & Contents
Integrations
Atlas Digital CORE Integration
Calix Cloud Data Field Mappings
Calix SMx Integration: Overview
CrowdFiber Integration
External Marketing Providers
GPS Tracking Providers: Overview
GoCardless Integration: Overview & Setup
Handling Static IPs with the Calix SMx Integration
How to Connect Cambium to your Sonar Instance
How to Connect Preseem to your Sonar System
How to: Using Webhooks in Sonar
Integrating with Calix Cloud
RemoteWinBox - Integration with Sonar
Sonar Retain: AI-Powered Customer Retention & Quality Intelligence
Tower Coverage Integration: Overview
VETRO FiberMap V2 Integration: Overview
VETRO FiberMap V3 Integration: Overview
Webhook Events: Overview
Webhooks in Sonar: Basic PHP Example
iCalendar Integration
Inventory
Inventory List View: Overview
Inventory Model Management: General Overview
Network Inventory: How-to & Usage Guide
Segmentable Inventory: How-to & Usage Guide
Setup of Inventory: Manufacturers, Categories, and Assignees
Tracking and Using Consumable Inventory
Jobs
Applying Task Templates to Jobs
Edit Job Options
Example Jobs & Templates
Geofences: Overview
Job Types: Best Practices
Jobs and Scheduling: Overview
Scheduling Dispatcher View: Overview
Scheduling How-to: Creating and Booking a Job
Scheduling Table View: Overview
Scheduling Week View: Overview
Setting Up Schedules General Overview
Mapping
Misc.
Combining Custom Fields & Task Templates for Information Storage
Custom Fields Overview & Use Cases
Custom Links: Overview
Task Templates Overview & Use Cases
Monitoring
Building Alerting Rotations
Building a Monitoring Template
Poller Troubleshooting
Pollers: General Overview, Deployment Strategy, Build Out & Setup
Networking
Adtran Mosaic Cloud Platform Integration: Overview
Assigning RADIUS Addresses
Assigning an IP Address Using Sonar's IPAM: How to
Automating IP Assignments, Data Rates, and Network Access in Sonar
Building Address Lists
Building RADIUS Groups
Building a Device Mapper
Cable Modem Provisioning
Controlling Customer Speeds with Sonar: General Overview
DHCP Delivery
Data Usage Available Methods
Finding your OIDs
FreeRADIUS 3: Build-Out & Integration
How Sonar Communicates - Egress IPs Explained
IP Assignments & Sonar
IPAM: Basic Setup
IPAM: Overview
LTE Integration
MikroTik as an Inline Device: Integration With Sonar
MikroTik: Controlling Access
MikroTik: Controlling Speeds
MikroTik: Setting Up a Sonar Controlled DHCP Server
Netflow On-Premise Integration: Setup and Overview
Network Dashboard: Overview
Network Sites: Management View Overview
PacketLogic: Integration With Sonar
Pulse, Polling, and PHP
RADIUS: Build-Out & Integration with Sonar
RADIUS: Building Reply Attributes
Setting Up CoA Proxy
Sonar Flow
Sonar IP Addressing
Using Multiple Network Devices in Sonar
Purchase Orders
Release Notes
Reporting
Common Custom Report Uses
Enhanced Business Intelligence - Tips & Tricks for Advanced Users
How To Enhance Your Reporting With Custom Field Data
How to Unpublish a Report or Dashboard
Managing Scheduled Reports
Report Licenses
Reporting Time Zone Behavior
Sonar's Business Intelligence: Overview
Understanding Sonar Reports
Using Sonar DataConnect to Connect BI Applications with Your Sonar Instance
Security
Application Firewall: General Overview and Best Practices
Auth0: Overview
Multi-Factor Authentication: Overview
Password Policy In Depth
Removing a Terminated Employee In Sonar
Role Creation using GraphiQL
User Role Creation & Best Practices
Users: Overview
Sonar Billing
sonarPay
How to Find Your Processing Rates in the sonarPay Portal
Reconciling sonarPay Disbursements with Bank Deposits
What to Expect After sonarPay Enrollment
sonarPay Canada Disbursements: Overview
sonarPay Chargebacks & Disputes: Overview
sonarPay Disbursements: Overview
sonarPay Migration: Approving Your Match & Going Live
sonarPay Migration: The Token Transfer & Matching Process
sonarPay Monthly Statement: Overview
sonarPay Overview
sonarPay Reversals, Voids, & Refunds: Overview
sonarPay: Token Migration Process
System
A Deeper Dive into the New Sonar API
API Calls Using Third Party Applications: Personal Access Tokens
Browser Compatibility and Minimum Hardware Requirements for Sonar
Consuming the Sonar API
Controlling Your Landing Page: Personal Preferences
Customizing Your Customer Portal
Date/Time Picker: Overview
Dynamic Time Zones in Sonar
Filtering: Overview
Frequently Used Terms
Getting Your Data into Sonar
GraphQL Rate Limiting Overview
How To Use GraphiQL to Understand the Sonar API
How Your Data is Backed Up
How to Best Use Global Search
Interacting with Files via the API
Introducing the New Sidebar
Main Menu: Overview
Mutations in the Sonar API
Notification Preferences
REST API Wrappers for V1 Compatibility
SMS Notifications
Sonar's Rich Text Editor
System Settings: Overview
The New Sonar API
Troubleshooting the Customer Portal
Upgrading your Ubuntu OS - Customer Portal Upgrades
User Profile: Your Personal User Settings
View History & All Logs: Overview
Ticketing
Advanced Ticketing Features
Canned Replies Examples & Templates
Canned Reply Categories
Exploring Ticket Groups
How Sonar Manages Spam Tickets
How to Integrate Inbound Mailboxes with Slack
Inbound Mailboxes Example Build
Ticket Category Families & Ticket Categories: Overview
Ticket Resolution Reasons: Overview
Ticketing: Overview
Using Parent Tickets
Voice
API Changes for Voice Billing
Best Practices to Remain CPNI Compliant
Billing Voice Services in Sonar
Deploying Voice Services in Sonar
Working With the Sonar Team & Additional Resources
Sonar's Security Practices & Certifications
Security & Compliance
Sonar and General Data Protection Regulation (GDPR)
Technical Security Overview
Best Practices for Fast Tracking a Support Request
Feedback Portal / Suggest a Feature
Learning with Sonar: Tools and Resources
New Client Training Overview
Sonar Casts Table of Contents
Submitting Bugs vs. Feature Requests
The Sonar Community Forum
The Sonar Status Page
Third Party Customer Support Referrals
Where Sonar Stores Your Data
Table of Contents
- All Categories
- Networking
- Network Dashboard: Overview
Network Dashboard: Overview
 Updated
by Mitchell Ivany
Updated
by Mitchell Ivany
Read Time: 5 mins
The Network Dashboard in Sonar is accessible from the main navigation panel and is split into the Dashboard and the Network Sites view.
The Dashboard View
The Dashboard View displays the status of your Inventory Devices, showing you devices that are in a Down or Warning state.
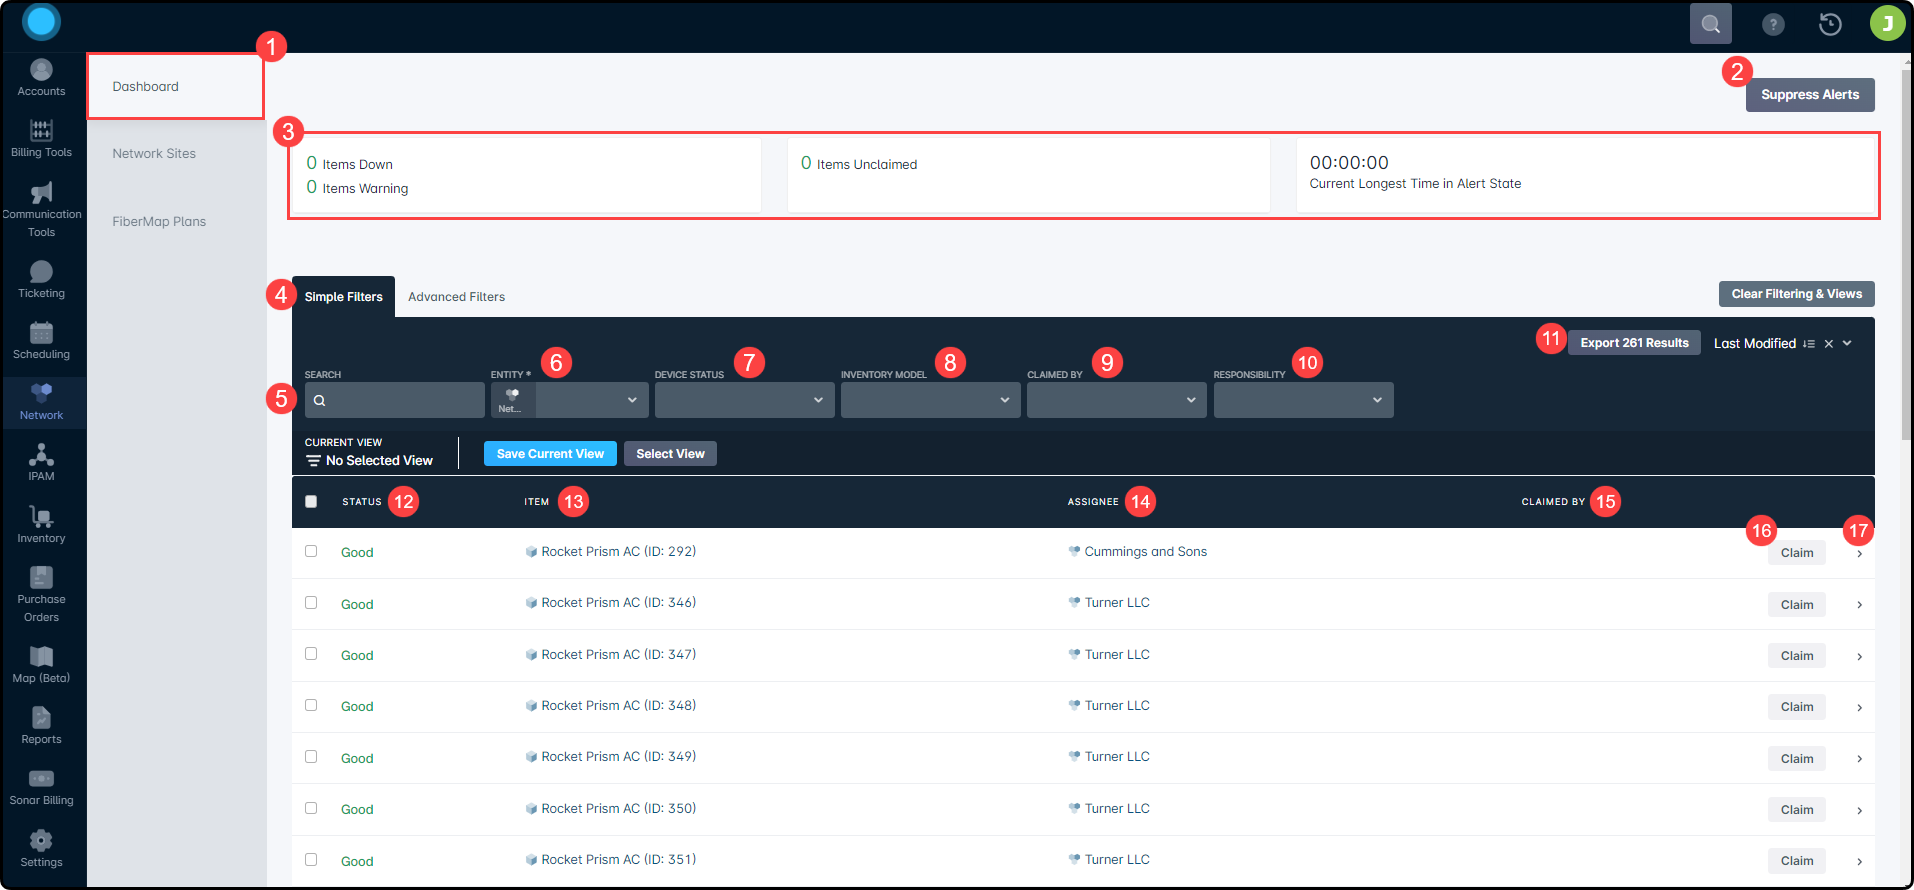
- The Dashboard/Network Site toggle allows you to switch between the Dashboard view (pictured above), the Network Sites view, and the FiberMap Plans
- With the Suppress Alerts button, you can halt all alerting rotation notifications from being sent out. Clicking this button will open a new window where you will specify the date and time you would like to suppress alerting until - this will effectively prevent everyone in the system from receiving any configured alerts until the specified date/time, at which point the notifications will resume. Typically, you would only use this button when you have some sort of global monitoring outage and want to suppress notifications as you are currently aware and working to resolve the issue.
- The Dashboard Summary provides an easy to view tally of devices in a Down or Warning state, how many of those devices are unclaimed, and the time in which the longest down or warning device has remained unclaimed.
- The Simple/Advanced toggle allows you to switch between the Simple filtering and the Advanced filtering. You can read more about that in our Filtering: Simple vs Advanced article.
- The Search bar allows you to search through the list of devices that are displayed, which match the existing filters.
- The Entity filter allows you to set the entity type for which you'd like to view devices, based on some existing entity types within your instance. It also allows you to type in a specific entity name if it's known (i.e., a Network Site name, or Inventory Location).
- The Device Status selector allows you to select from a list of device statuses, from Good, Warning, or Down.
- The Inventory Model selector allows you to search for a specific device model and display only the selected device type(s).
- The Claimed By selector allows you to view the devices that are claimed by a specific user, or multiple users.
- The Responsibility selector allows you to view only devices that have been assigned or claimed by you.
- The Export Results button allows you to export a list of all devices that appear based on the selected filters.
- The Status column represents the state of the device and will reflect whether the device is in a “Good”, a “Warning”, or a “Down” state. It will also display the cause of the status change, whether the cause of the “Warning” or the cause of the “Down” state.
- The Item column will provide the name/model of the device.
- The Assignee column shows which Inventory Location the device in the row is assigned to.
- The Claimed By column displays the name of the user who has claimed the device, whether in a trouble state or not
- The Claim button allows you to claim a device in order to assume responsibility for repairing or managing a device on the list. If a device is currently claimed, the user with the claim will see a new button, Unclaim.
- The arrow corresponding with each line item opens a sidebar that details additional information such as ICMP and SNMP results, along with access to further assignee information including the serviceable address and a comprehensive list of items on-site.
Network Sites List View
The Network Sites page presents a condensed view of the points in your network that permit customer connection. Each added network site is created by providing an address, a height in meters, and a unique name for the network site. Additionally, the Network Sites landing page provides a list of devices in a “Warning” or “Down” state without needing to open the site management page.
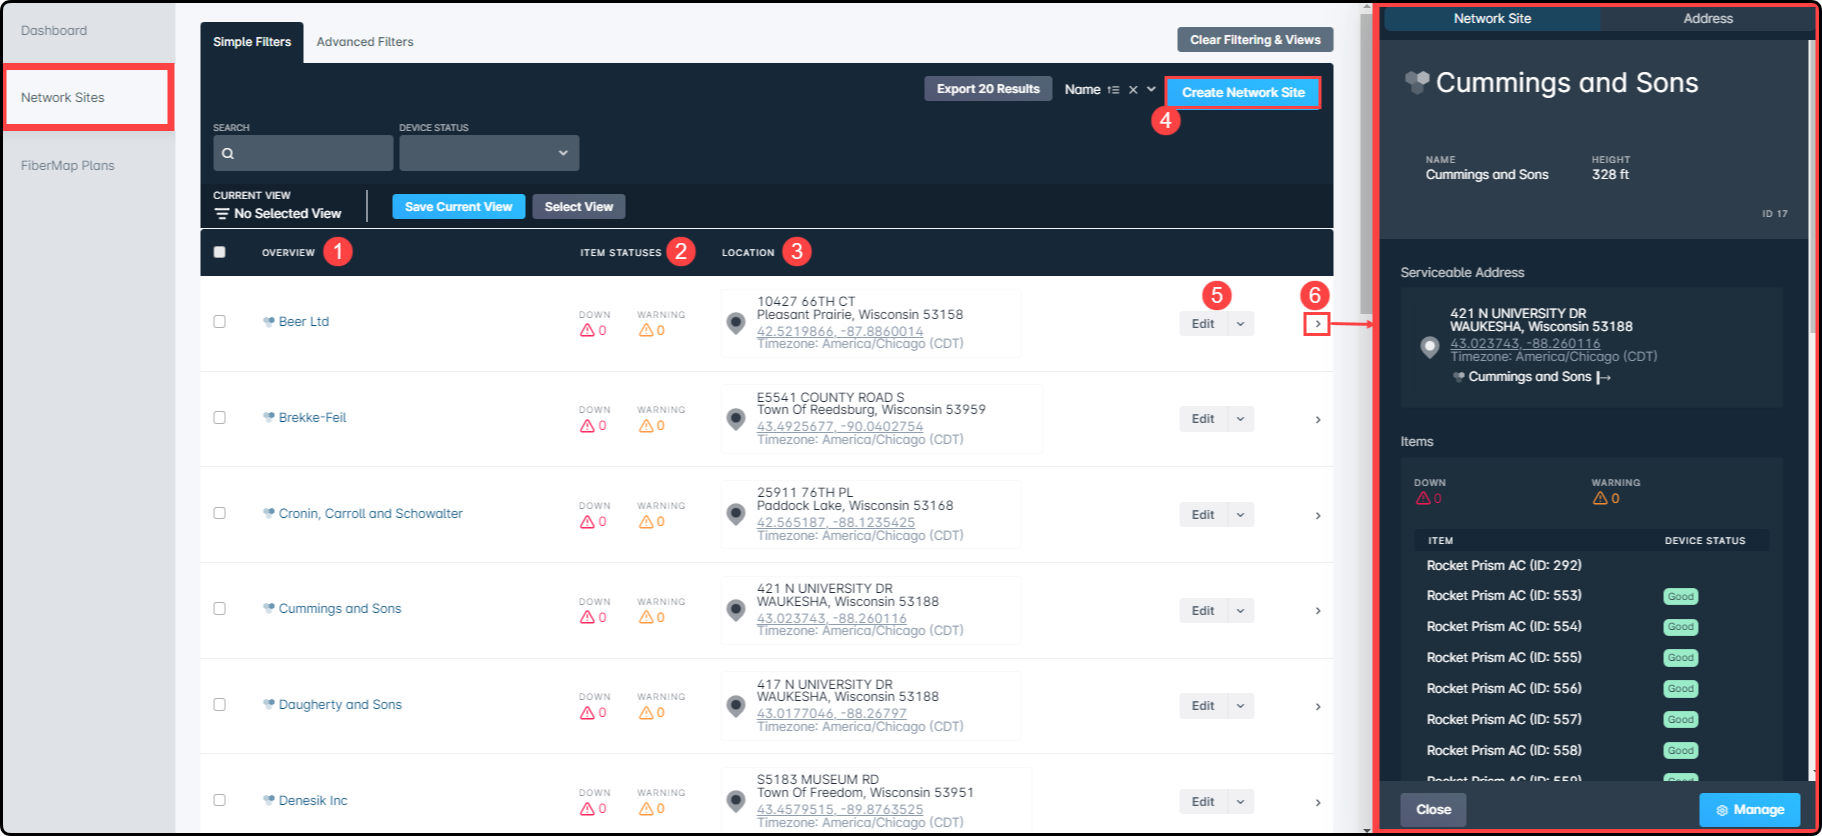
- The Overview column: This column lists the name of the Network Site. Clicking on the name will open the Network Site management page.
- The Item Statuses column: This column provides a quick look at devices on the Network Site which may be experiencing connectivity issues
- The Location column: This column lists the physical address of the Network Site
- Clicking the “Create Network Site” button will open the Network Site creation modal, requiring completion of descriptive fields, and address validation.
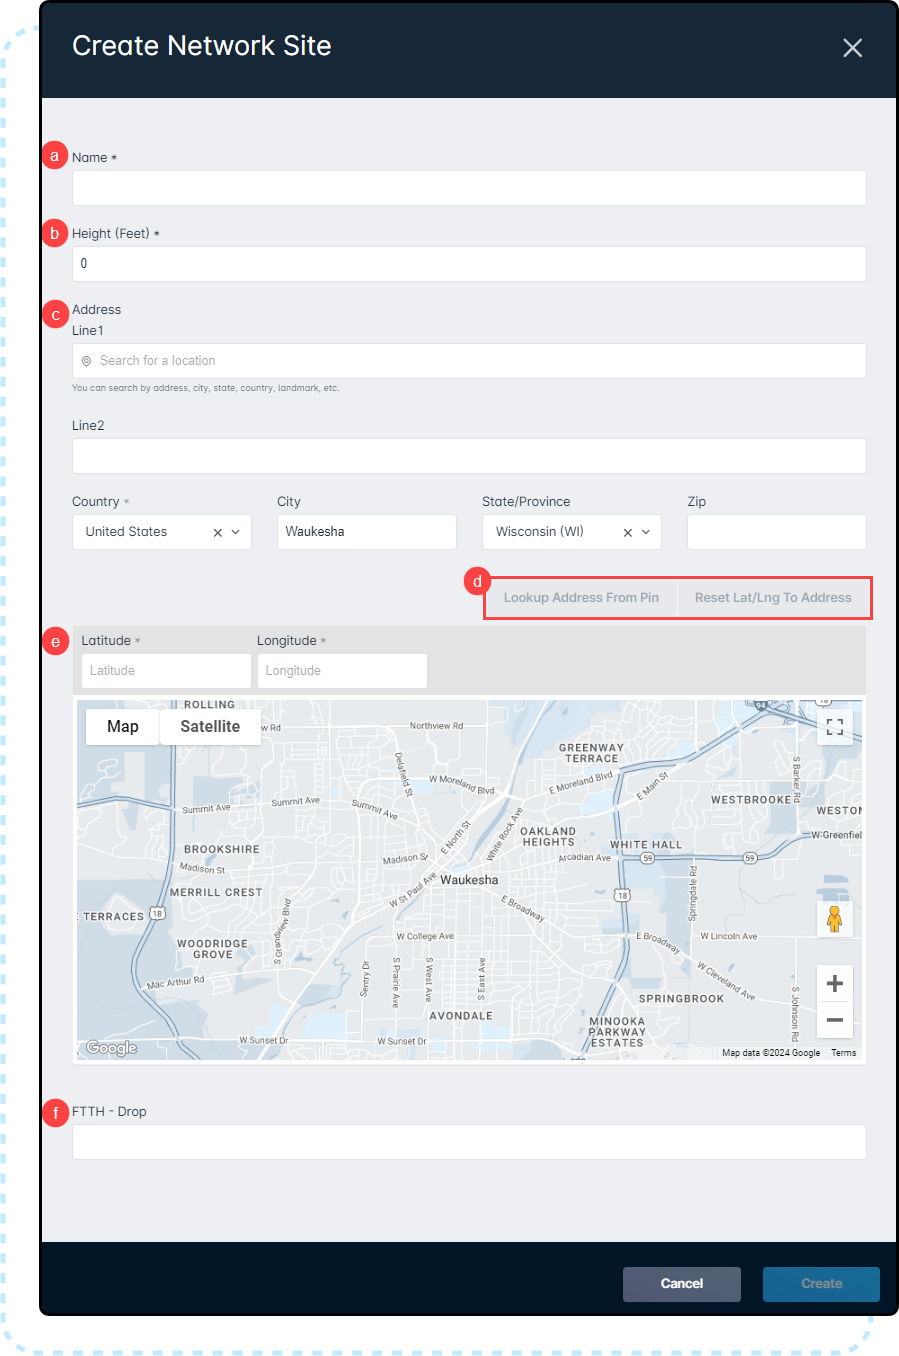
- The Name of the Network Site, displayed in reports and in the Overview column
- The Height, in Feet, of your Network Site's maximum height above ground elevation. This is used as the default value when showing elevation profiles from potential serviceable addresses to the Network Site.
- The physical address of the network site. These fields are used to calculate a precise street address, which can then be used to generate a set of Latitude and Longitude coordinates.
- In lieu of a physical address, Latitude and Longitude coordinates can be entered directly, which allows you to place the network site exactly where it should be on the map.Latitude and Longitude are used as the determining factor for a location as they provide the most accuracy when calculating for a line of sight to serviceable addresses
- The “Lookup Address From Pin” and “Reset Lat/Lng To Address” options are available to use once a pin has been dropped and then dragged to a different location on the map. Selecting “Lookup Address From Pin” will provide you with the street address to where the pin is located. Next, “Reset Lat/Lng to Address” will to generate coordinates based on the newly entered street address.
- Your Custom Fields for Network Sites appear here, in a list below the map.
- The Edit button allows you to:
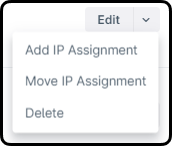
- Edit the physical location or Latitude/Longitude of the Network Site by clicking on the Edit button.
- Add an IP assignment by clicking on the drop-down next to “Edit”.
- Move IP Assignment by clicking on the drop-down next to “Edit”.
- Delete the Network Site by clicking on the drop-down next to “Edit”.
- The Network Site sidebar - opened by clicking on the arrow corresponding with the name of the Network Site under the overview column - displays more detailed information on the Network site, such as its Height (in feet), its serviceable address, any items connected to this Network Site, and their connection health, and the activity log for this site. Clicking on “Manage” from this sidebar will take you to the Network Site management page.