Table of Contents
Building a Monitoring Template

Read Time: 8 mins
What is a monitoring template:
A monitoring template in Sonar is a template that can be applied to specific device models or deployment types to monitor them.
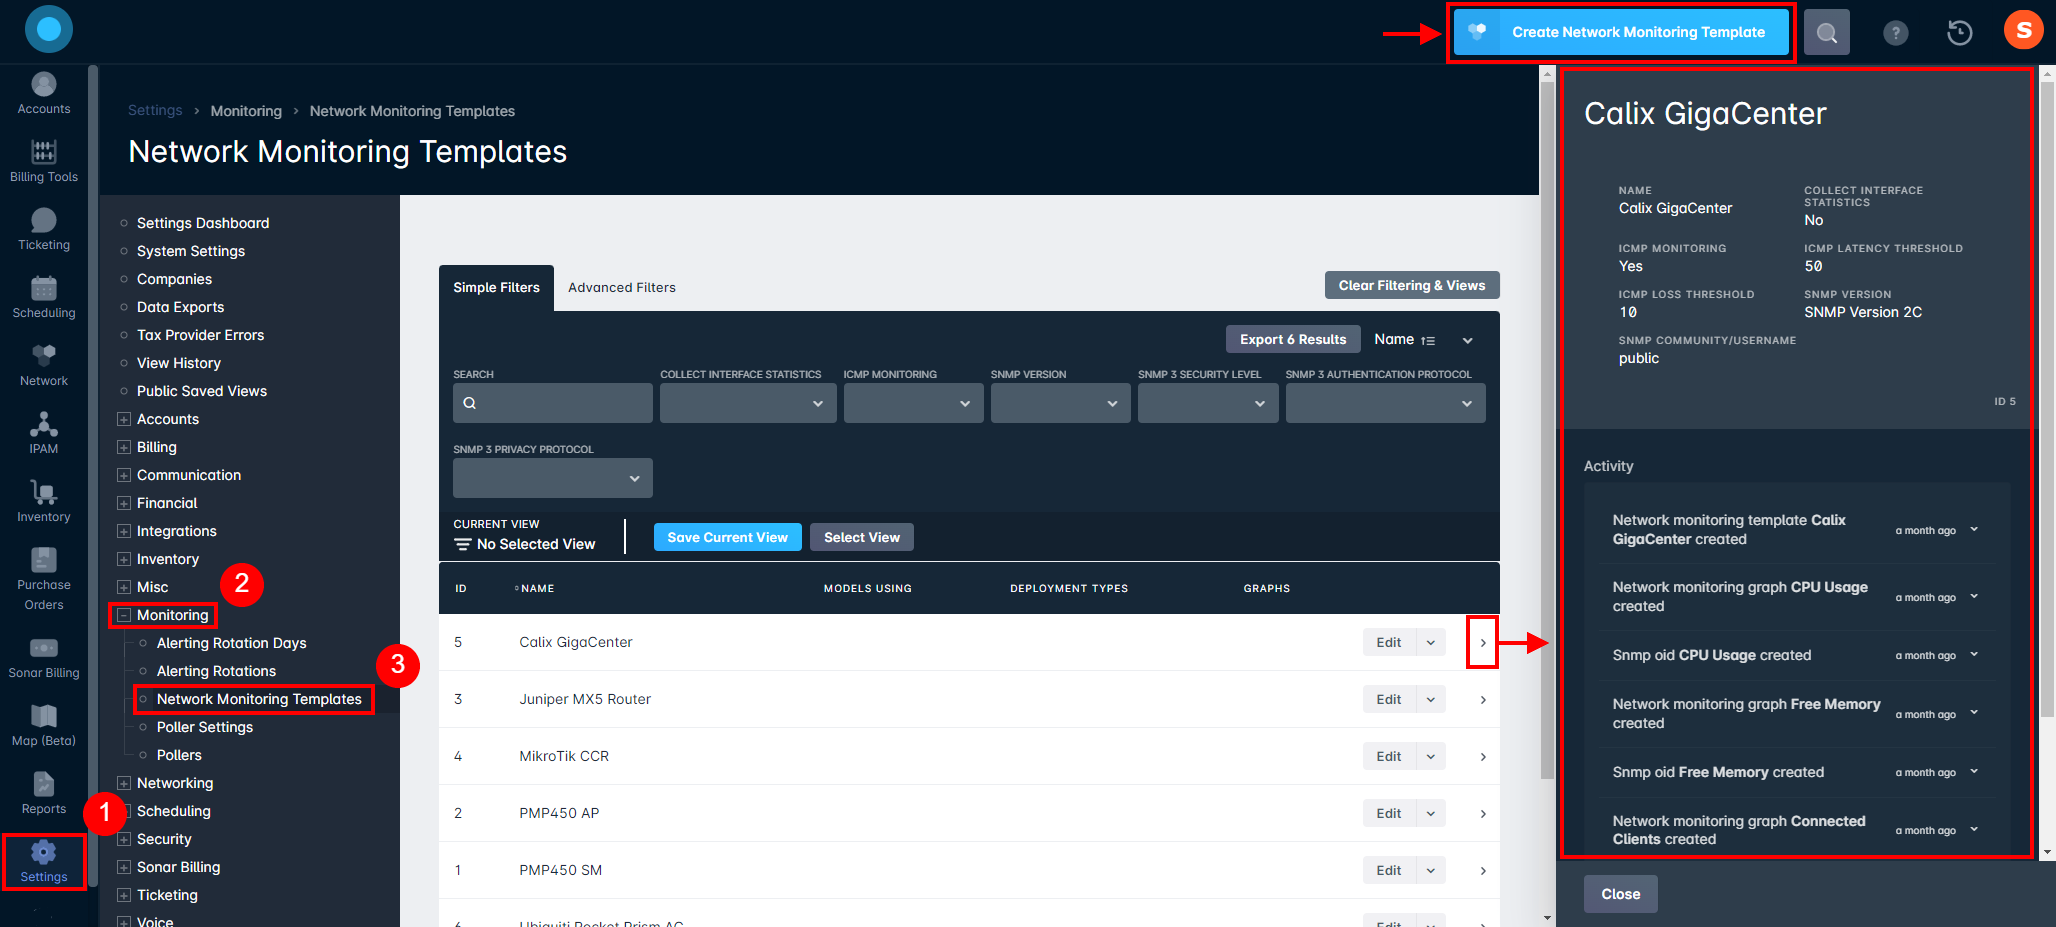
Creating your monitoring template
Monitoring Template creation occurs in multiple stages upon accessing the Settings page and clicking on the Create Network Monitoring Template button:
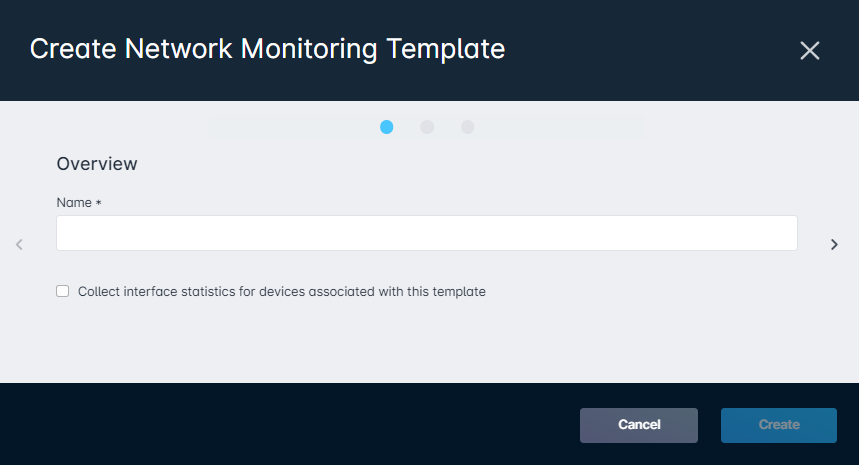
- Name: The name of the monitoring template. The name should describe what kind of device you will monitor.
- Collecting Interface Statistics: Having this box checked will gather specific stats for this device. For example, it will try to get all the MAC addresses associated with this device and certain stats like the speeds or throughput for each port.
- To view your Interface statistics, you will need to go into the Pulse tab under the Network Site management page and click on a device. This will populate a sidebar reflecting the device interface information.
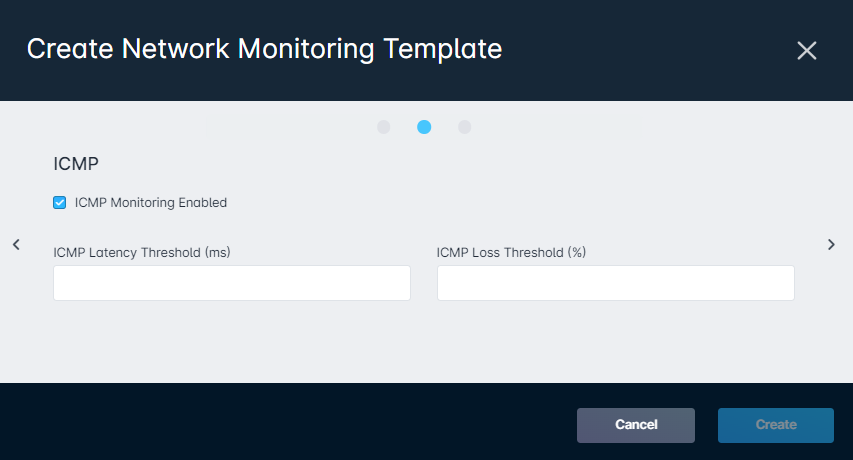
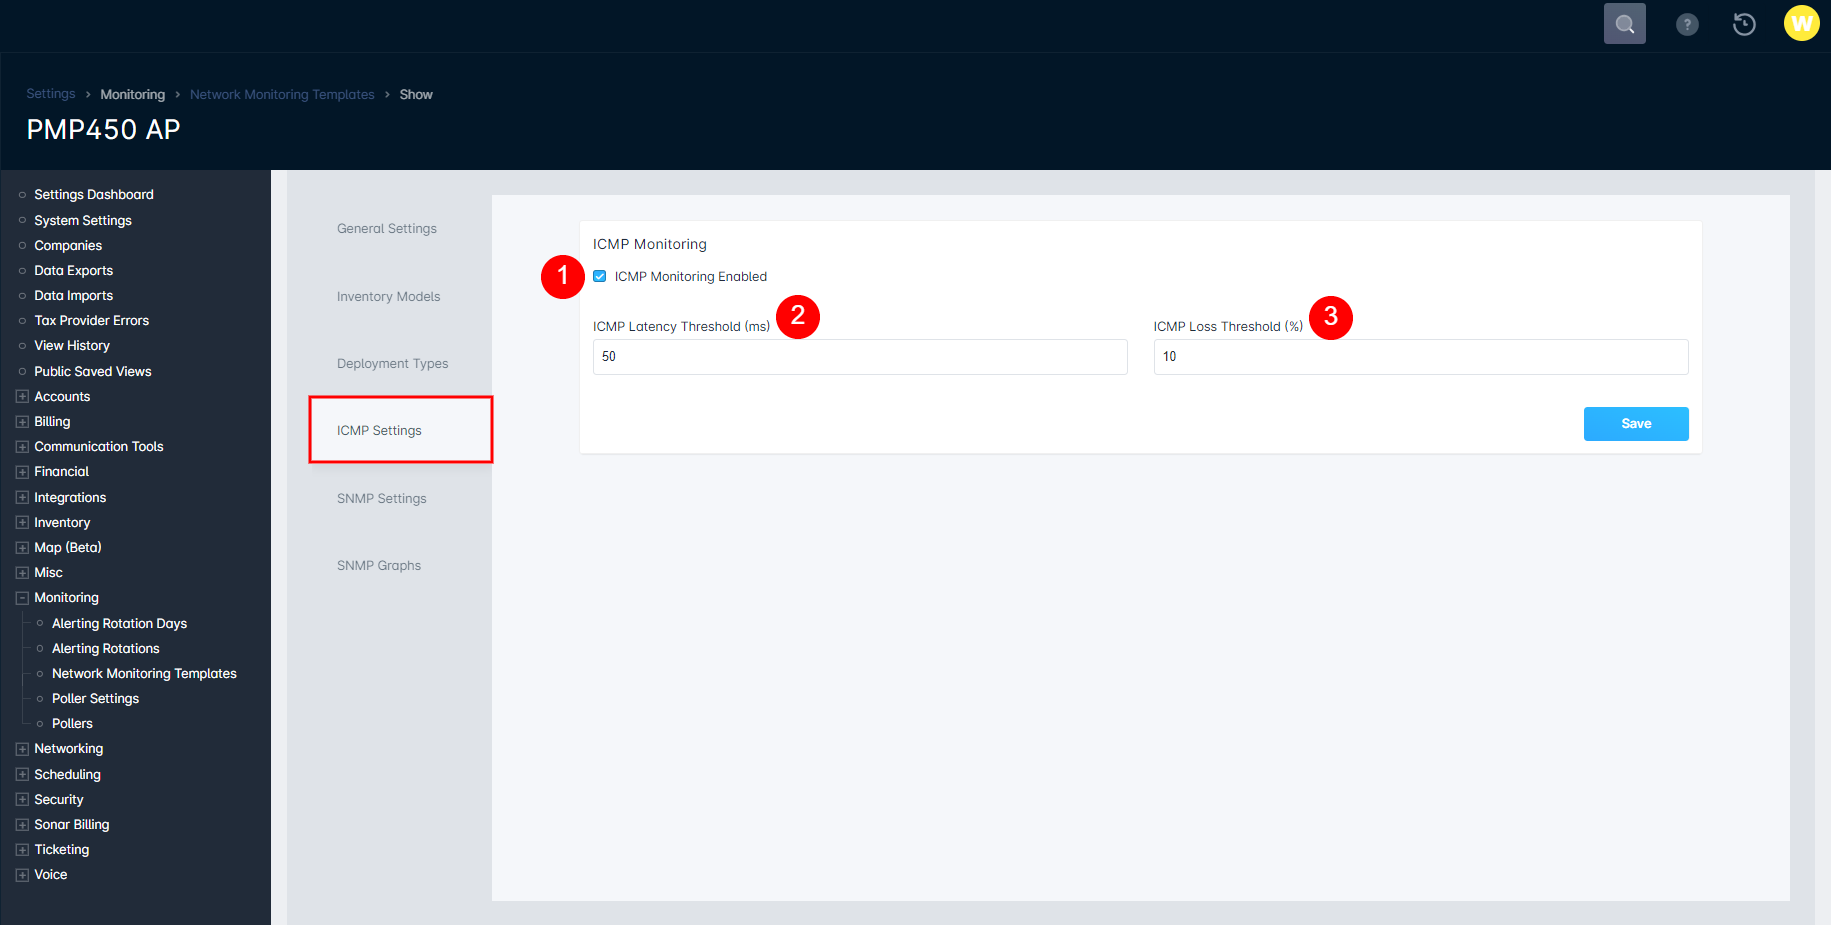
- ICMP Monitoring: When ICMP monitoring is enabled, you can define the latency threshold and packet loss threshold. If any of the above conditions are met or exceeded, the device is considered down in Sonar.
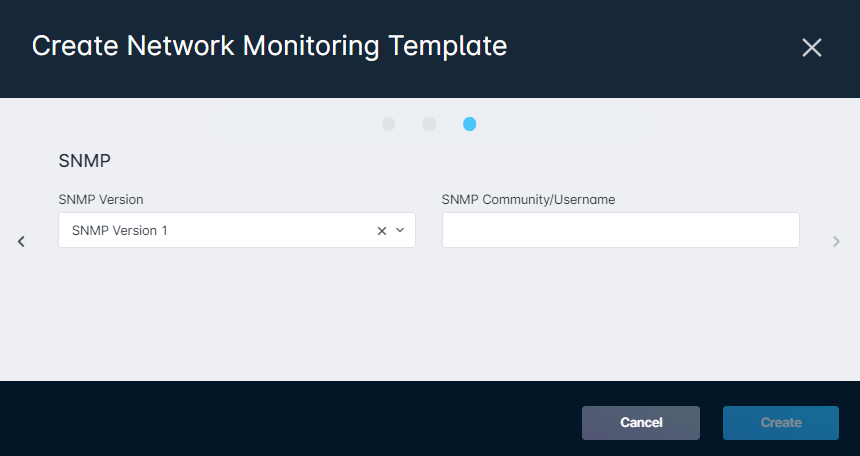
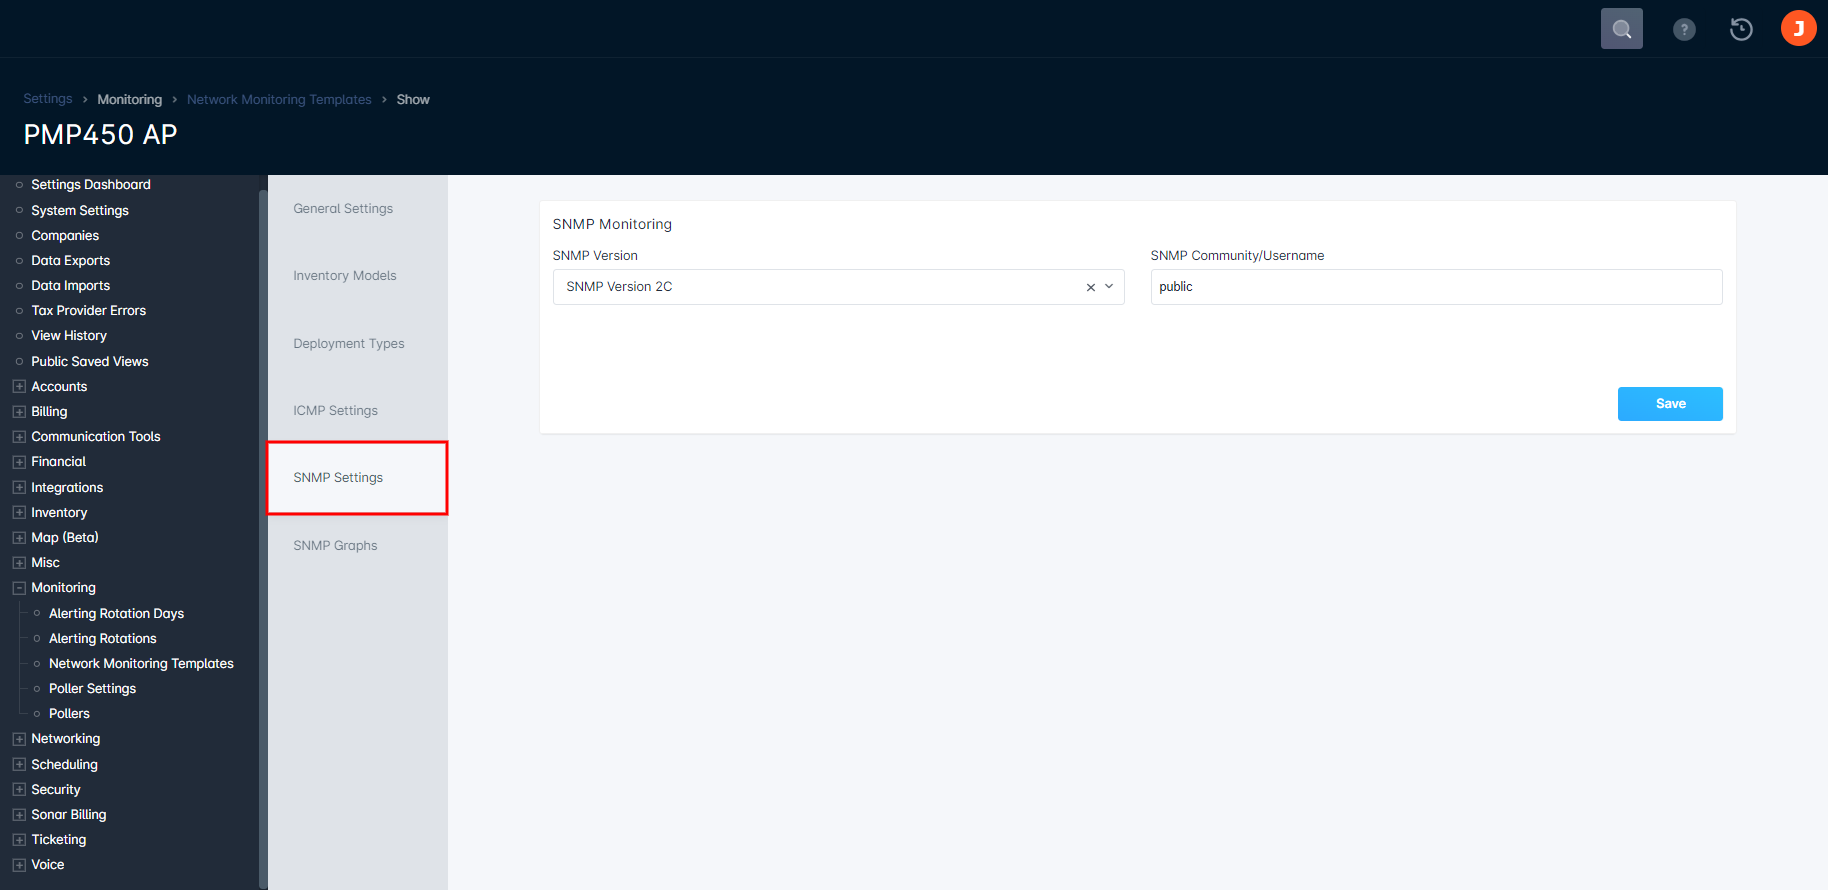
- SNMP Monitoring: SNMP monitoring allows for better monitoring of your devices. When SNMP monitoring is enabled, you need to define the version supported by your device, and also the community string. A community string functions like a password.
- Version 1: The oldest SNMP version available. All devices support this version, although it is not the most secure and should not be used if version 2c or 3 is available. Note: all Ubiquiti devices support v1 only.
- Version 2c: Version 2 is the most popular version being used, and it supports 64 bit counters.
- Version 3: is the newest and most secure version of SNMP. It is important to note that not all devices support V3.
Editing Your Monitoring Template
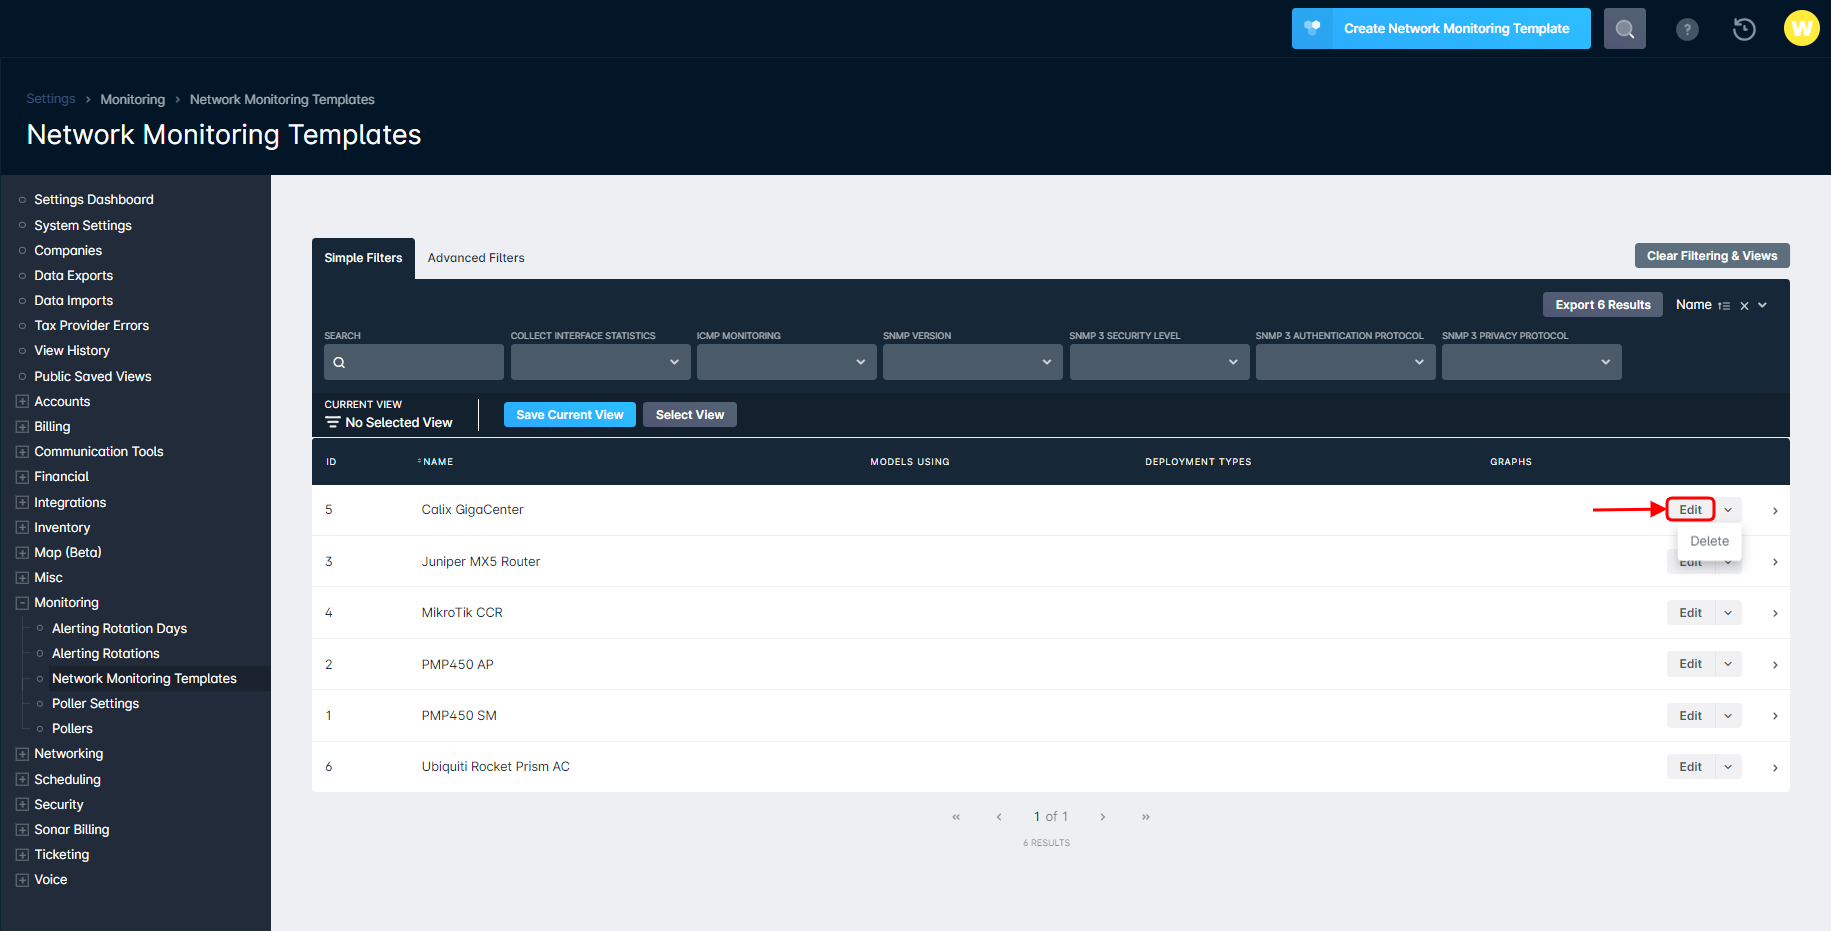
Once you've created your monitoring template, you can then edit the information and settings associated with it by clicking “Edit” on the corresponding line item. A new page will populate with the following tabs:
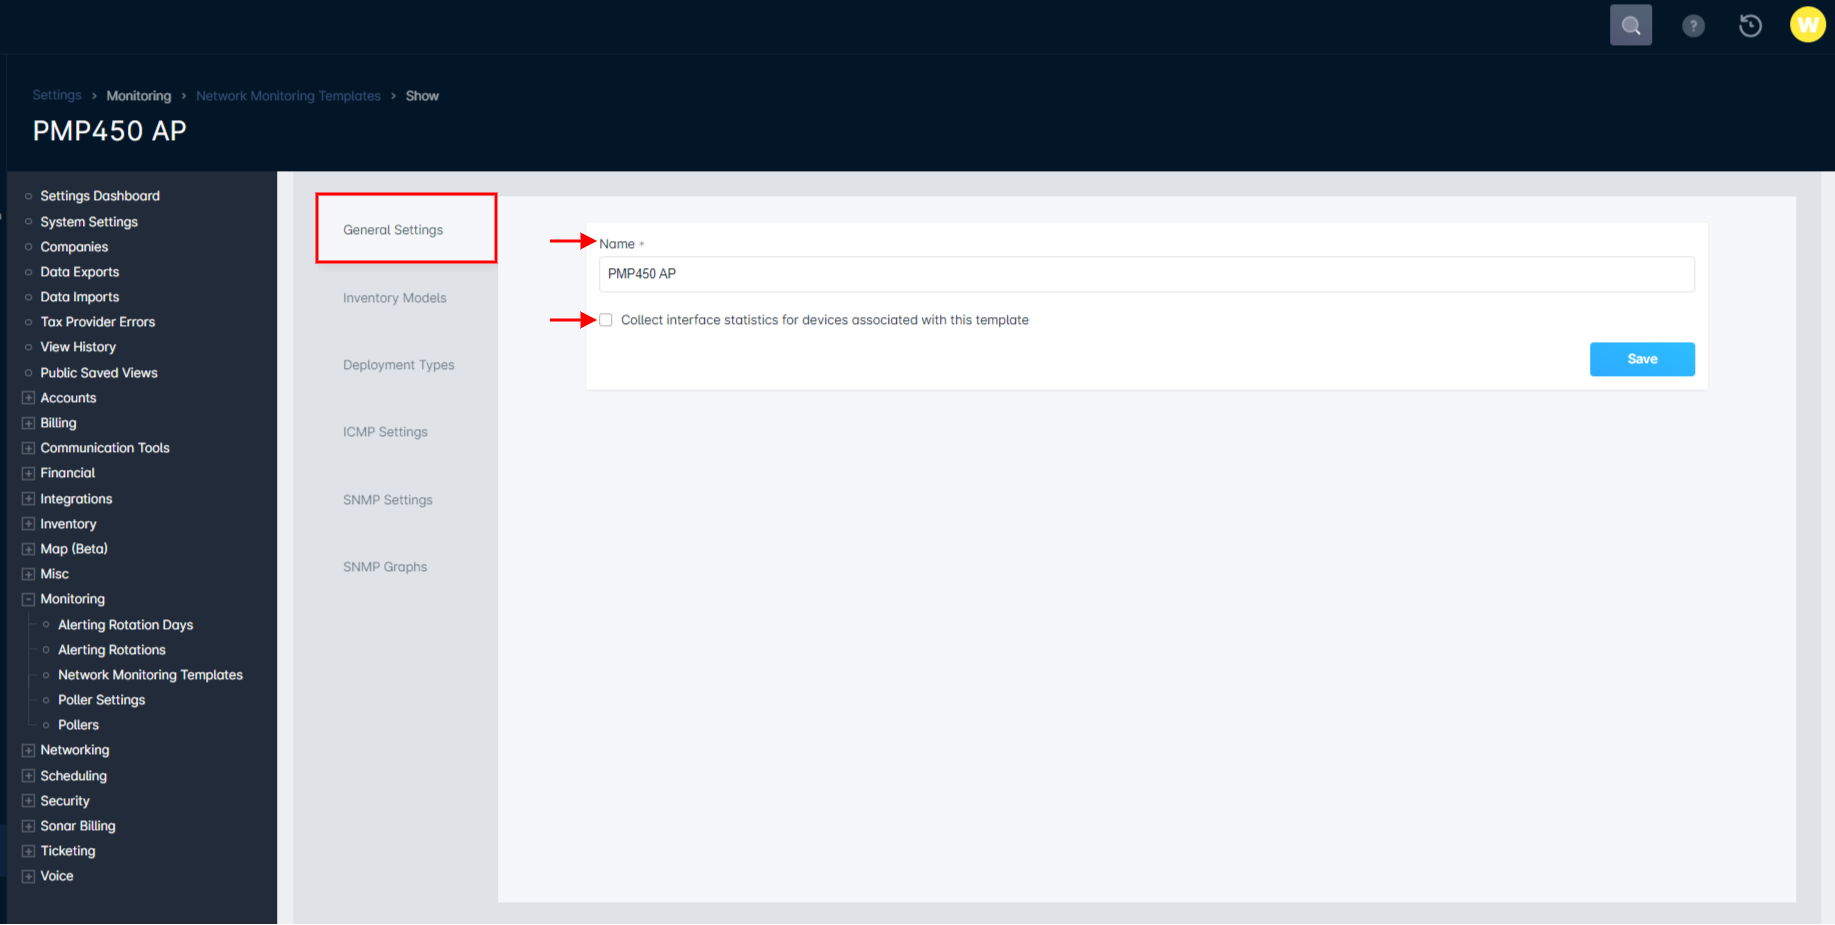
- General Settings allow you to rename the template and enable “Collect interface statistics for devices associated with this template”.To view your Interface statistics, you will need to go into the Pulse tab under the Network Site management page and click on a device. This will populate a sidebar reflecting the device interface information.
- Inventory Models allow you to add previously created inventory models that will be targeted for monitoring by that specific template. It is recommended to only monitor one manufacturer per template, as mixing manufacturers will make selecting the OIDs more difficult.
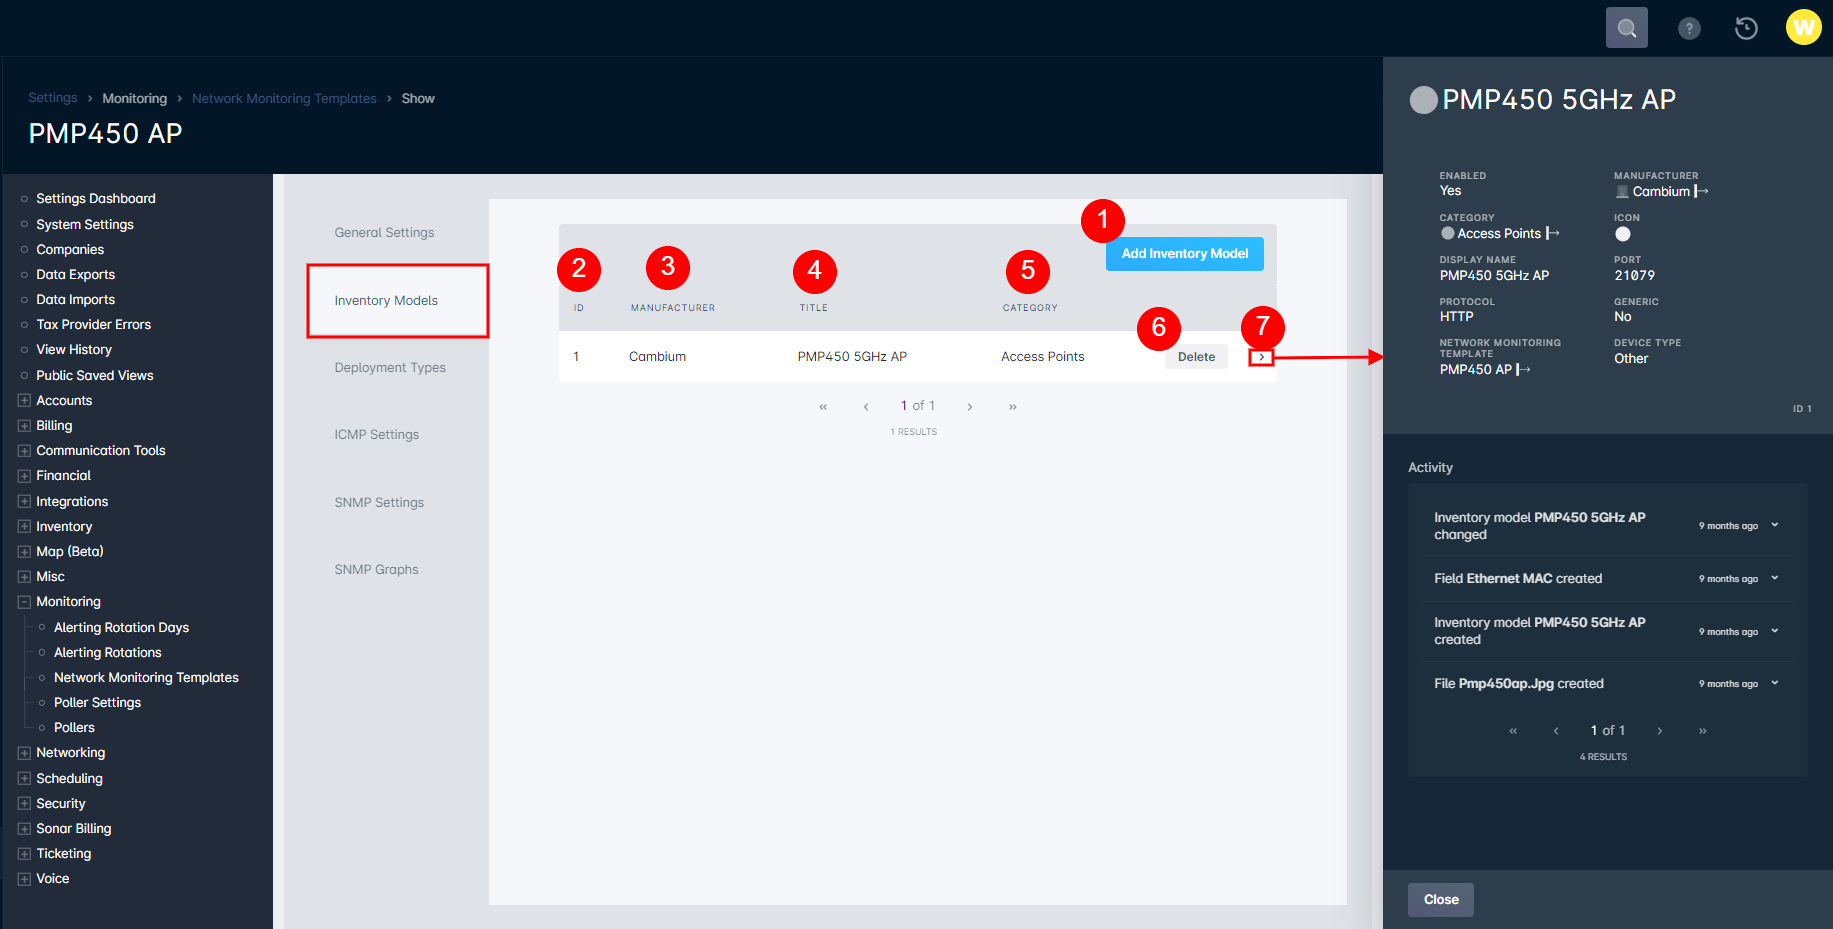
- Add Inventory Model button allows you to add individual inventory models for the monitoring template.
- ID column provides the identification number assigned to the inventory model for the monitoring template.
- Manufacturer column provides the name of the inventory manufacturer for the model selected.
- Title column provides the name of the inventory model selected.
- Category column provides the inventory category for the model selected.
- Delete button will remove the selected model from the monitoring template.
- Sidebar detail panel provides detailed information on the inventory model that is selected for the monitoring template.
- Deployment Types allow you to add further filtering to your monitoring template, allowing you to monitor specific deployments of the previously selected inventory models.
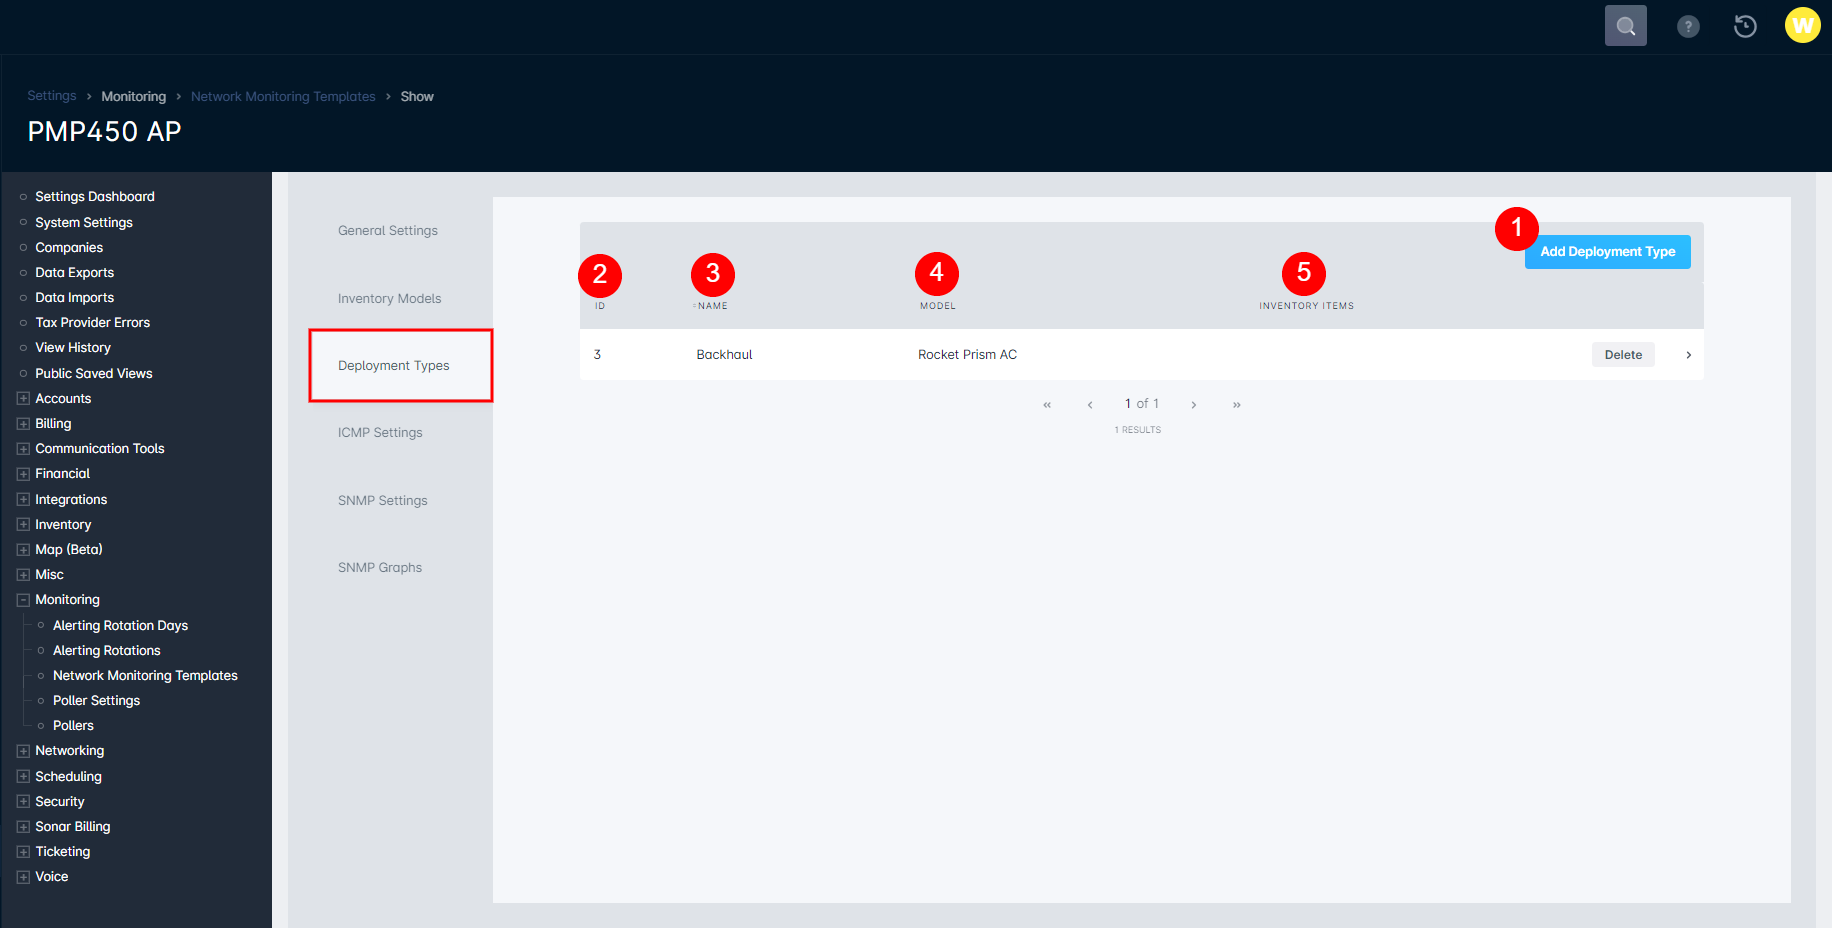
- Add Deployment Type button will provide a pop up window which allows you to select the correct deployment type for the inventory being assigned to the monitoring template.
- ID column provides the identification number assigned to the deployment type for the monitoring template
- Name column provides the name identification for the type of deployment that is selected.
- Model column provides the name of what model of inventory is selected with this monitoring template.
- Inventory Items column displays the number of inventory items that are set to that specific deployment type.
- ICMP Settings allow you to adjust the ICMP settings used when initially creating the monitoring template. Including enabling/disabling this setting and adjusting the latency threshold and loss threshold fields.
- SNMP Settings allow you to adjust the SNMP settings used when initially creating the monitoring template.
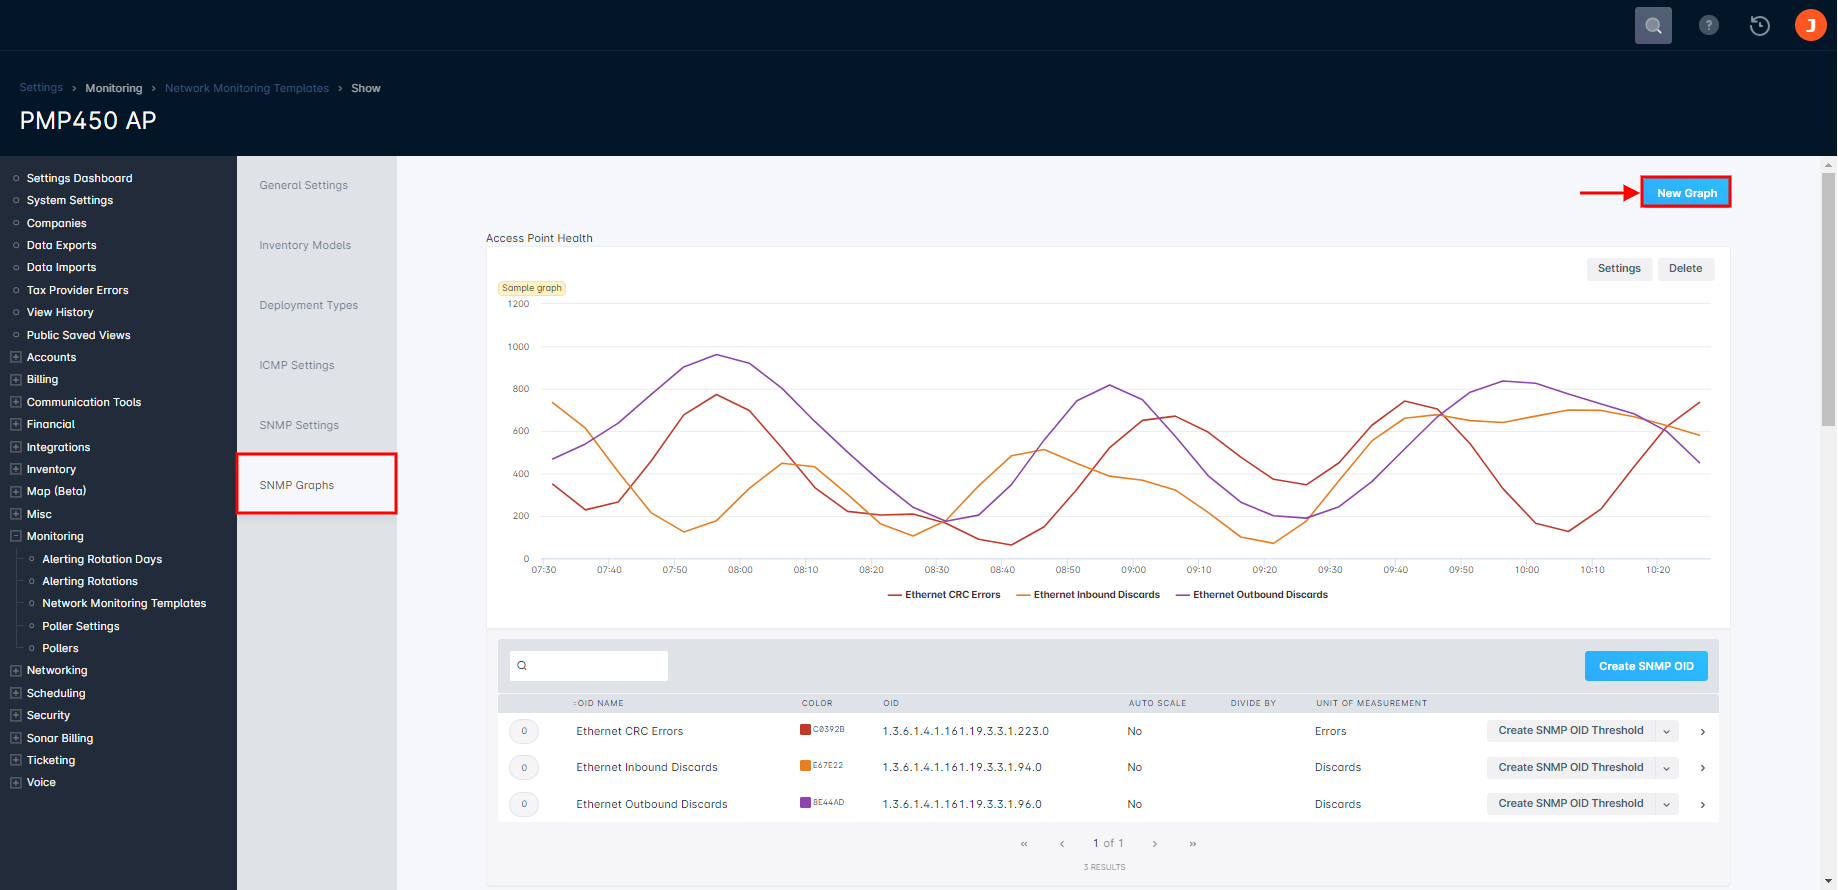
- SNMP Graphs provide access to creating an SNMP graph for your monitoring template, which we'll touch on further below.
Creating a SNMP graph
When you create a SNMP graph, you can specify one or multiple OIDs to be graphed. Generally, it is recommended to input and graph OIDs that match a certain criteria (e.g., rate, power, etc.)
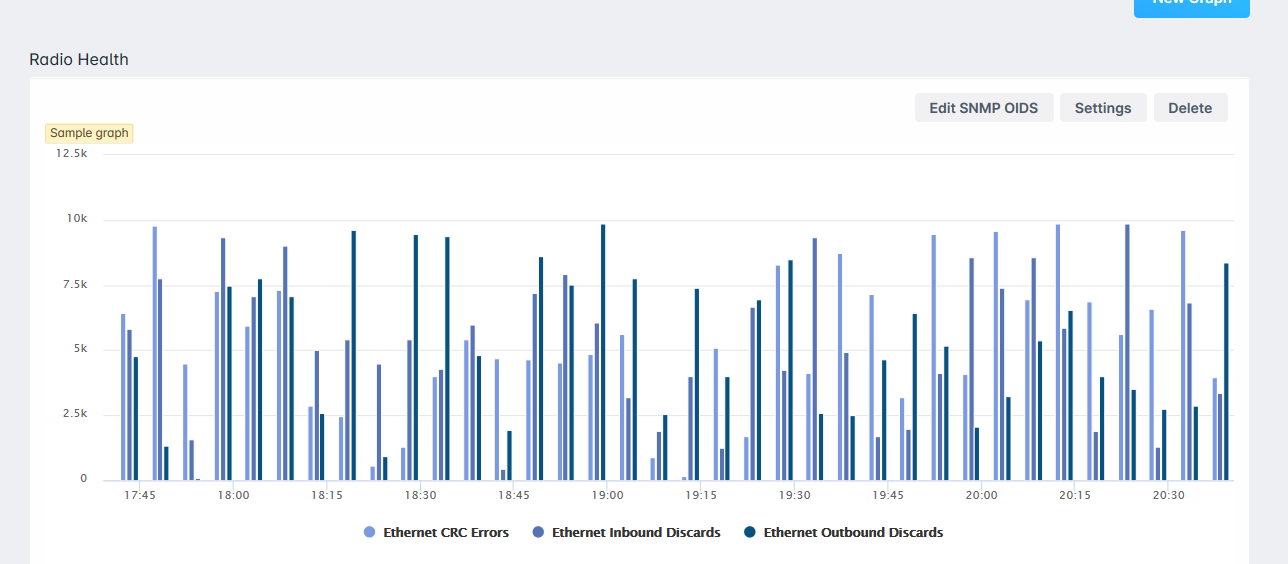
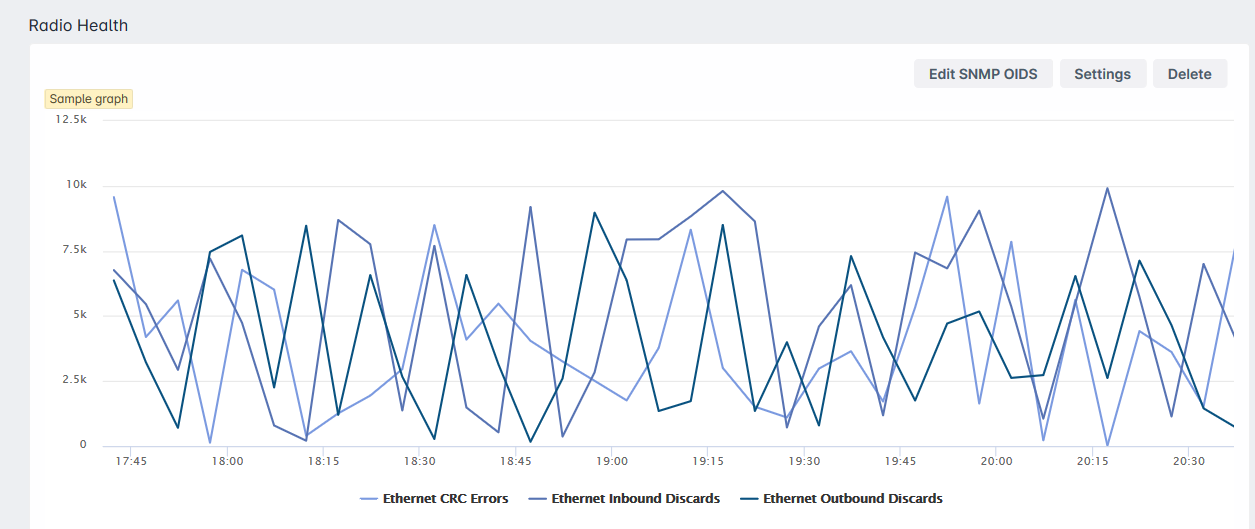
When you create a graph, you are given three options on how the graph will be displayed.
Area Graph:
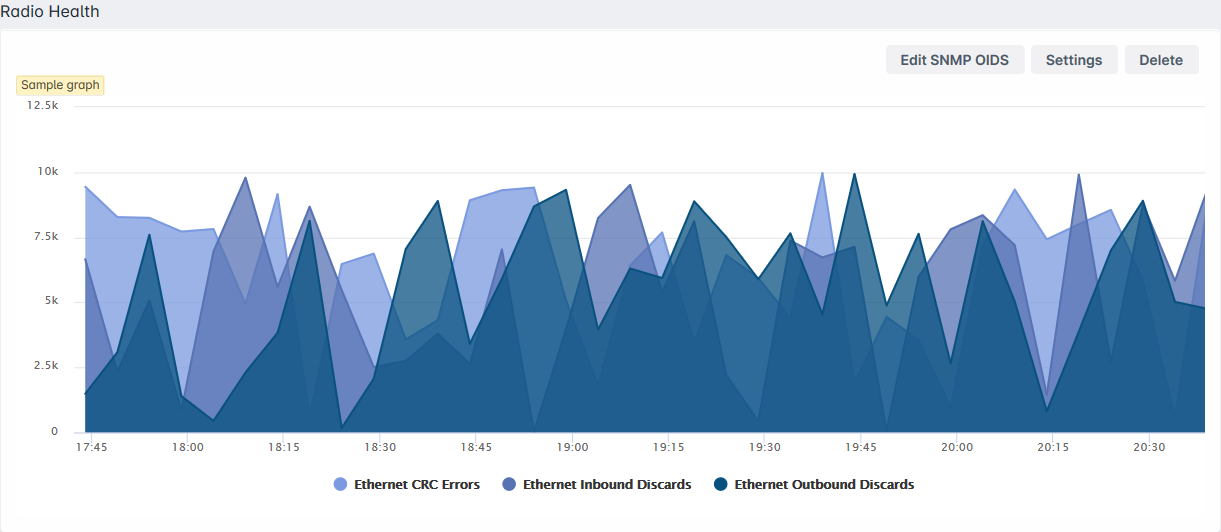
Bar Graph:
Line Graph:
Customizing your graphs
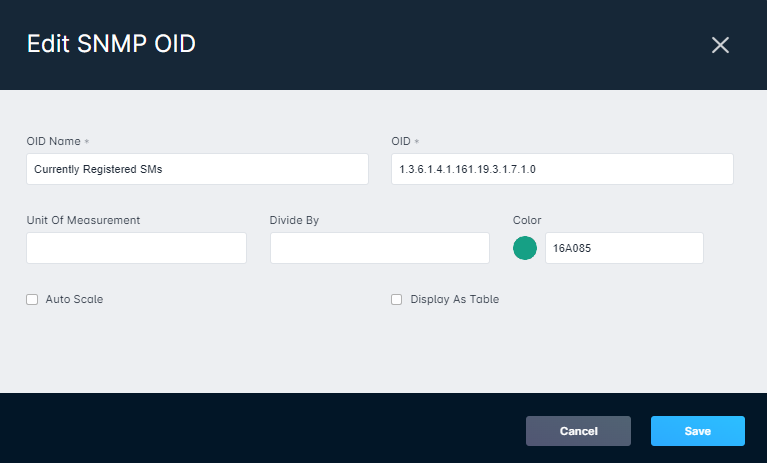
Once you have the correct OID, back in Sonar Monitoring Graphs, click on Edit SNMP OID. Then, type a SNMP OID name and OID copied from the Ireasoning MIB browser. In here you can specify if you want the info to be displayed as a table rather than a graph, and specify if there is a unit of measurement (for example download or upload speed kb/s). If you wanted this info to convert to something else, you can define the unit of measurement and what number to divide it by. Lastly, you will choose what color the graph will be displayed.
Creating a SNMP OID Threshold
An SNMP OID threshold tells Sonar when a polled value is out of range. When a threshold is violated, the device moves into a warning state, which surfaces it on the Network Dashboard and makes it eligible for alerting rotation notifications. Thresholds are configured per SNMP OID, so the OID has to exist on the monitoring template before a threshold can be added to it.
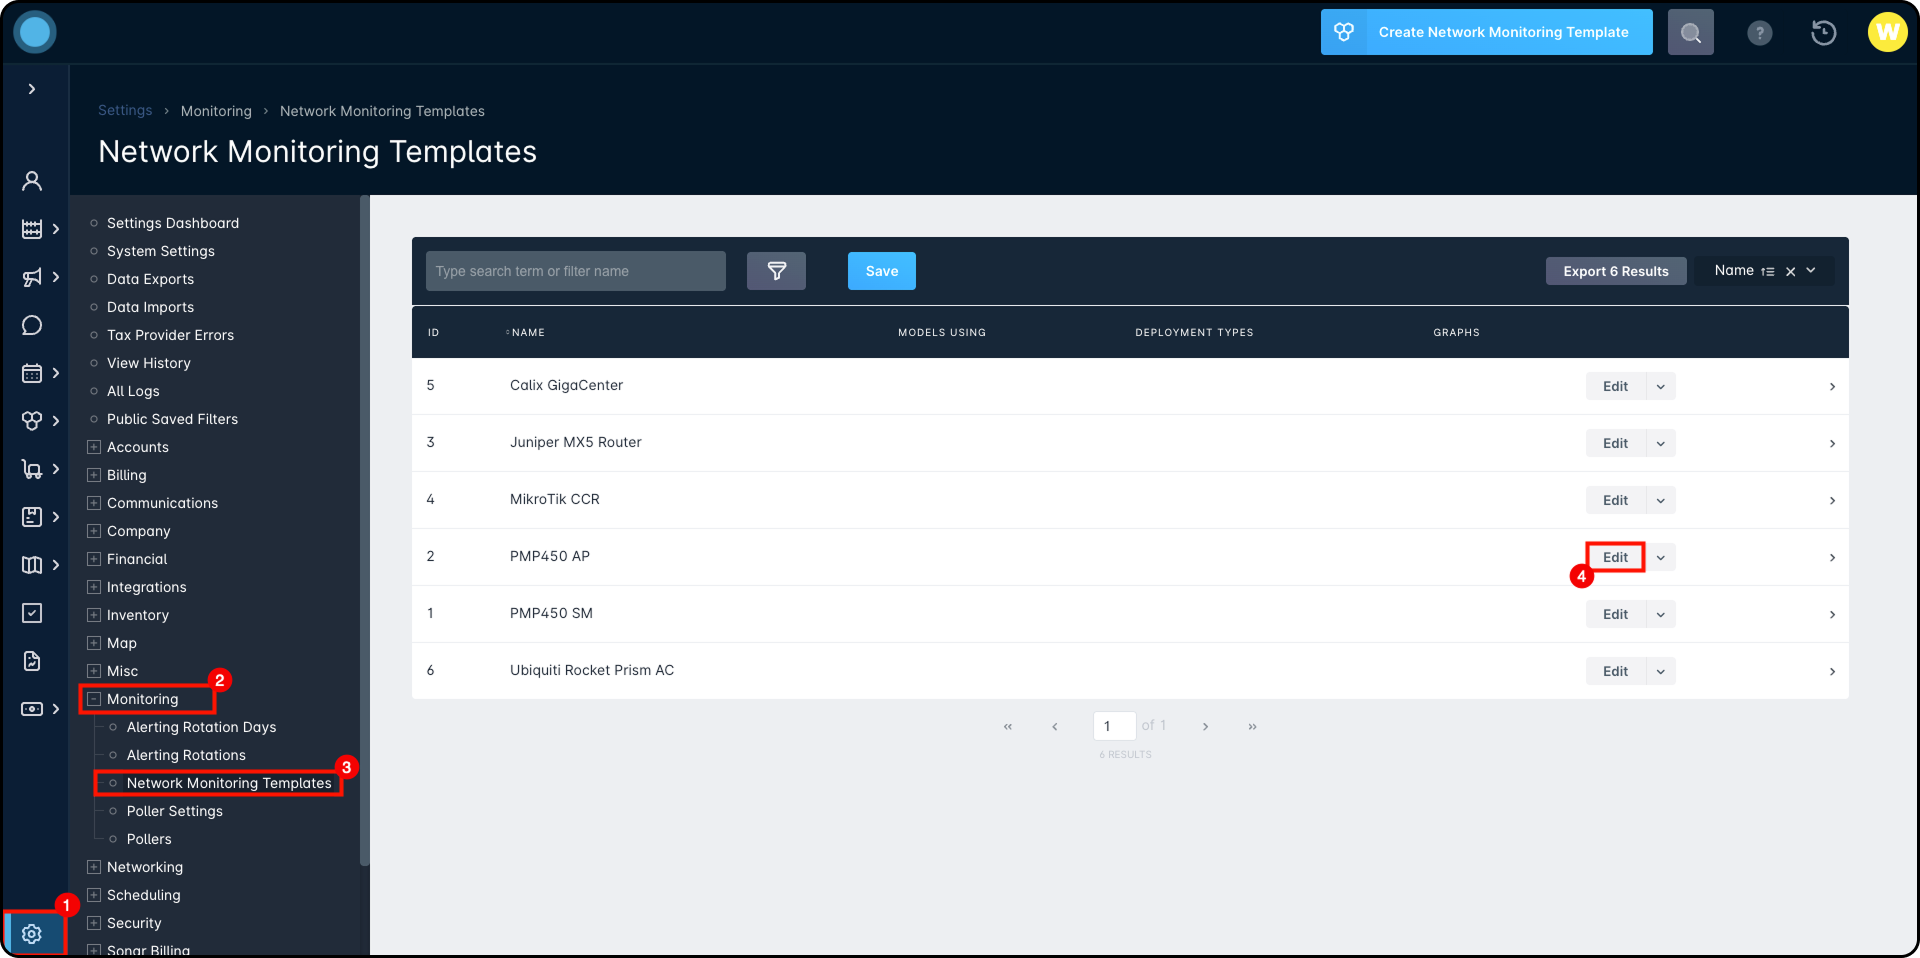
- Click the Settings icon.
- Expand Monitoring.
- Select Network Monitoring Templates.
- Click Edit on the template that contains the OID you want to monitor.
Open the monitoring template you want to work with, locate the SNMP OID you want to monitor, and select the threshold option on that line item.
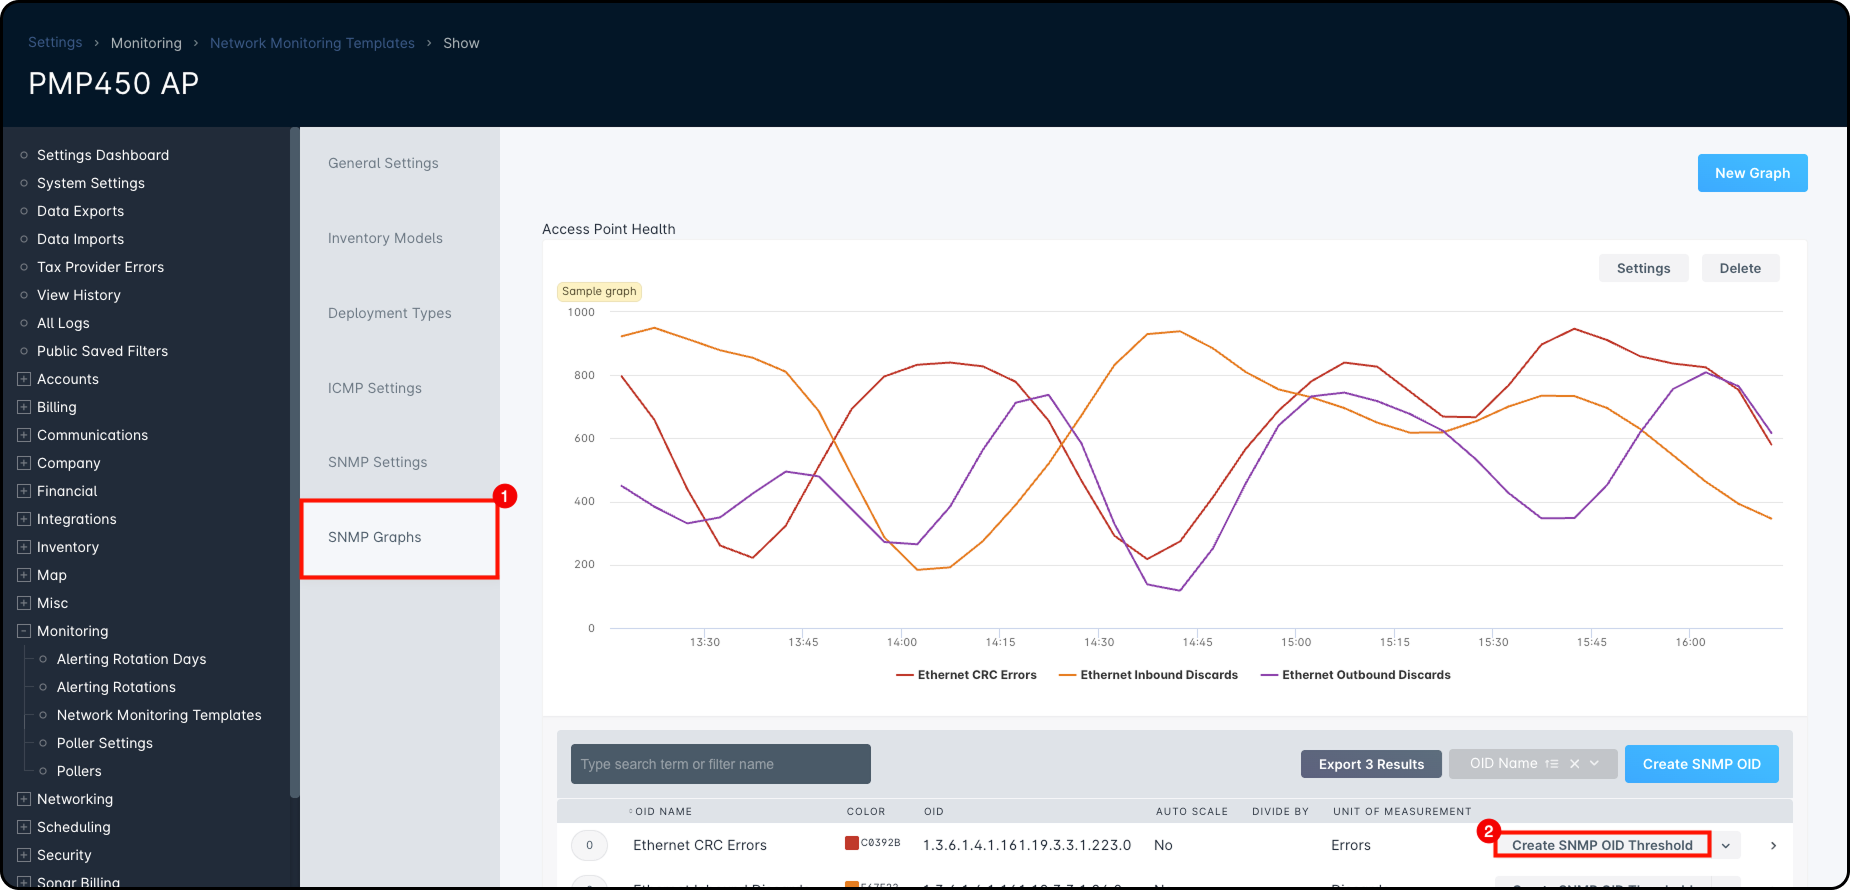
- Select the SNMP Graphs tab. The SNMP OIDs configured on this template are listed below the graph, along with each OID's Divide By value and Unit of Measurement.
- Click Create SNMP OID Threshold on the line item for the OID you want to monitor. Use the dropdown arrow beside the button to view or edit thresholds that already exist on that OID.
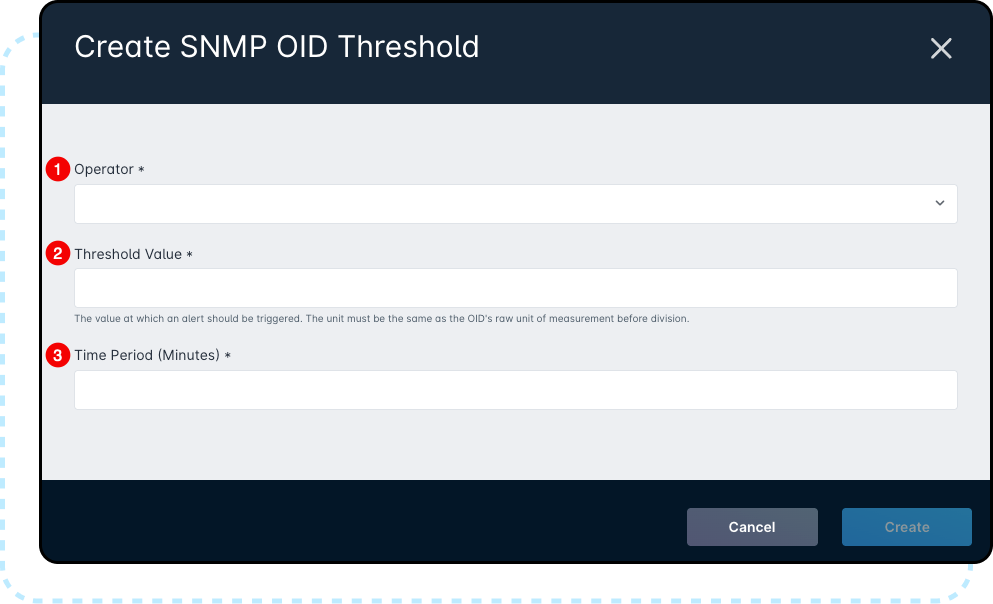
- Operator: The comparison Sonar performs between the value the device returns and the value you enter below. For example, a "greater than" operator flags the device when the polled value rises above your threshold value, and a "less than" operator flags it when the polled value drops below it.
- Threshold Value: The number the polled result is compared against. This must be entered as the raw value returned by the SNMP device, not the value displayed on the graph.
- Time Period (Minutes): How long the condition has to be met before Sonar records a violation and moves the device into a warning state. This prevents a single poll spike from generating an alert. Because the threshold carries its own time period, the Warning Minutes Before First Alert setting on an alerting rotation is ignored for SNMP threshold violations.
Viewing your SNMP / ICMP Results
Once you've configured a Monitoring Template and a Poller, the results will be viewable via a few different locations:
- From Inventory > Inventory Items and by clicking on the arrow relating to the selected line item. This will populate a sidebar reflecting historical graphs of the ICMP and SNMP information.
- From Network > Dashboard and by clicking on the arrow relating to the selected line item. This will also populate a sidebar reflecting historical graphs of the ICMP and SNMP information.
- When viewing a customer's account, navigate to Network & Inventory > Inventory Items and click on the arrow relating to the inventory item you wish to view further. Once again, this will populate the same sidebar as the other two methods.
- Each serviceable address has access to this information too by selecting Inventory Items on the management overview page and opening the same sidebar from there.